ISEC
International Structural Engineering and Construction Society

COVID-19 Report
as of 8/11/2020
The most important news is twofold:
1) Vaccine research is going full swing
2) Cases in the world are increasing!
Vaccines
Essentially, 16 countries are researching the COVID vaccine – US, Germany, China, Great Britain, Hong Kong, India, Singapore, Japan,
South Korea, France, Israel, Russia, Switzerland, Australia, Canada, Sweden. The vaccines must go through the following phases before
released for mass scale use:
1) Pre-trials
2) Testing safety and dosage
3) Expanded safety trials
4) Large scale efficacy tests
5) Limited use
6) Mass use
These Vaccines are of five types -- Genetic, protein-based, viral vector, whole-purpose, and repurposed.
So far, there have been 30 Vaccines in human trials, and more than 135 pre-trial vaccines, with only one vaccine approved for limited use. Russia announced a vaccine for use before undertaking large scale human testing, hoping that its vaccine will succeed in the mass scale. The race for being the first to develop a vaccine is risky, in that a less than perfect vaccine may be released upon people. But still, if researchers take the vaccine development slowly, then the human race stands to suffer. We can only hope that rigorous trials and strict protocol are followed at a fast pace.
With some luck, there will be a suitable vaccine by the end of 2020 or by the first quarter of 2021. Even then, there is a chance that people may catch the illness even with taking the vaccine, just as in normal flu vaccines, where the chance of actually suffering from the vaccine with the virus injected is a whopping 36%.
World Cases
The new daily cases in the world are still high. A five day moving average does not reveal a significant decline. However, there are signs that the USA may be coming down from its peak. Israel and Brazil show lesser signs of reduction; Egypt and Russia show a very good decline; but, India shows an ever-increasing surge. India has already emerged as the country with the highest new daily cases, 67000. However, this may not be the real number as many experts suspect. That said, India is still very low in cases per million – at the 91st position of countries in the world.
Latin America also has five countries in the top ten of daily new cases – probably owing to the poverty there. Spain and France have also returned minor second waves. However, UK, Germany, and Turkey have shown stability at low levels.
EURO MED SEC 3: This conference was successfully delivered in hybrid format – with on-site and virtual online delivery.
ASEA SEC 5: New Zealand had only four cases this week (in contrast to zero for the past few months and thousands of cases in other
countries), and that too all in one family, but they locked down the country, as a result. New Zealand tends to be extra safe, and is
still a poster country when it comes to having contained the virus. ASEA SEC 5 shall be delivered in a hybrid format, as well.
Closure:
The volatility in the world has only increased. Economies are generally in trouble; massive amounts of printed money owing to the COVID downturn have made gold prices surge, signaling inflation and economic uncertainty; the COVID crisis has destroyed companies and affected employment. The US is plagued by internal forces pulling in different directions; US-China hostility, Sino-Indian hostility, and Sino-Japanese hostility have picked up. The only sector to have gained is the environment as pollution levels came down for a while and the plant kingdom and wildlife got a respite. There is no doubt that there are forces more strong than what humans can contain or understand. But, with tongue in cheek, it is possible to say that the human race is going to emerge stronger once COVID is overcome.
Best wishes to you all!
COVID-19 Case Histograms (Aug 11)
COVID-19 Control Charts (Aug 11)
Past Reports
Table I (discontinued as of 7/16): Ratio of Average New Cases of Recent Five Days to Peak
The Data
There are various ways by which to look at the reported data. One method is to look at the percent of the population that caught the virus in any country.
From Worldometer, we get the flwg data for the percent of people infected in any country (top 12):
| Country | % Infected |
| Qatar | 3.85% |
| Bahrain | 2.27% |
| Chile | 1.78% |
| Kuwait | 1.47% |
| Oman | 1.45% |
| Panama | 1.35% |
| USA | 1.28% |
| Armenia | 1.23% |
| Peru | 1.14% |
| Brazil | 1.10% |
| Singapore | 0.89% |
| Sweden | 0.78% |
| World | 0.20% |
We see here that the concentration is in the Persian Gulf and Latin America.
The death ratio in the population gives a different picture about the severity of the infection and the resistance to infection in specific countries. It is not entirely clear whether the COVID strains are different in the Gulf vs. what was found in Europe.
| Country | % Dying |
| Belgium | 0.085% |
| UK | 0.067% |
| Spain | 0.061% |
| Italy | 0.058% |
| Sweden | 0.056% |
| Peru | 0.054% |
| Chile | 0.047% |
| France | 0.046% |
| USA | 0.045% |
| Brazil | 0.040% |
| Netherlands | 0.036% |
| Mexico | 0.033% |
| World | 0.008% |
There is a predominance of European countries in the death rate. It is not clear whether Europeans actually have lower immunity to the
virus or whether they experienced a more virulent strain. Latin American countries and USA countries appear in this chart as well as in
the one before.
And, from Daily New Cases, we get the flwg top countries. These represent where the disease contributes most to world cases.
| Country | New Daily Cases |
| USA | 78,000 |
| Brazil | 58,000 |
| India | 49,000 |
| South Africa | 14,000 |
| Mexico | 8,500 |
| Colombia | 7,000 |
| Russia | 6,000 |
| Argentina | 5,500 |
| Peru | 5,000 |
| Bangladesh | 2,500 |
| Chile | 2,500 |
| Iran | 2,500 |
| World | 290,000 |
The most of these countries are from the Americas. It turns out that the Americas are the most common in all the three charts above. This goes to say something about the prevalence and severity of the disease there.
Symptom Clusters
On July 17, Reuters reported based on studies at King’s College, London, that there are six different symptom patterns that COVID
patients get:
2 ‘Flu-like’ with fever: Headache, loss of smell, cough, sore throat, hoarseness, fever, loss of appetite.
3 Gastrointestinal: Headache, loss of smell, loss of appetite, diarrhoea, sore throat, chest pain, no cough.
4 Severe level one, fatigue: Headache, loss of smell, cough, fever, hoarseness, chest pain, fatigue.
5 Severe level two, confusion: Headache, loss of smell, loss of appetite, cough, fever, hoarseness, sore throat, chest pain, fatigue, confusion, muscle pain.
6 Severe level three, abdominal and respiratory: Headache, loss of smell, loss of appetite, cough, fever, hoarseness, sore throat, chest pain, fatigue, confusion, muscle pain, shortness of breath, diarrhoea, abdominal pain.
This can mean two things, that -
(2) There are six different strains of COVID. If this is the case, one vaccine may not work: six different vaccines will be required.
EURO MED SEC 3: Zoom rehearsals have been held for participants and moderators. Additional sessions are scheduled. Participants should avail of these rehearsal sessions to ensure a smooth virtual conference on Aug 04.
Closure
Vaccine trials are ongoing in USA, Britain, Germany, India, and China. (If we missed out any country, please write to us). Let’s hope for the best.
USA, Brazil, India, South Africa, and Colombia continue to lead the world in daily new cases, and rising in daily cases by leaps and bounds of 3-4% daily. The World reached a new record of new daily cases yesterday.
It must be observed that USA and Israel are on a massive second wave that is larger than the first wave. India is still climbing exponentially on its first wave. Egypt and Russia are showing signs of controlling the virus.
The USA got worse for probably two reasons:
1) For the Black Lives Matter protests
2) For the 4th of July celebrations
3) For all the graduation celebrations
Brazil is bad because of a disorganized health management structure; India has reached Stage III, but that is because there are too many slums, too many poor, and insufficient ability to quarantine the infected. South Africa is lunging in its cases owing to poverty, bureaucratic issues, and uneven access to health care.
In all this turmoil, there is some hope in that economies are returning; and China is amazing to the extent it has fantastically
controlled the spread of the disease in the country. But, finally, and most importantly, there is hope for a vaccine (read
https://www.staradvertiser.com/2020/07/14/breaking-news/first-experimental-coronavirus-vaccine-poised-for-final-testing/).
EURO MED SEC 3: Preparations are in full swing to deliver the conference online as well as on-site. Moderators have rehearsed their
role for virtual delivery; and participants shall be offered rehearsal times for virtual delivery on Zoom over the next two weeks before
the conference on 22nd July, 9am; 24th July 9 pm; 27th July 9 am; 30th July, 9 pm (all are Cyprus dates and times).
ASEA SEC 5: Manuscript review has nearly completed, and now is the time for authors to register. Though New Zealand is doing great
with COVID control, one cannot say that for the world, as a whole, though Europe and South East Asia have been a great success story. Therefore, even ASEA SEC 5 will be delivered in hybrid format, i.e., both online and on-site.
ISEC-11: Presently reviewing abstracts and manuscripts. The abstract submission date is being extended once again to August 20
because of the turmoil caused around the world by COVID.
Closure
COVID will surely stay on Earth for quite some time to come, albeit in a subdued fashion, even after the vaccine. But, once an effective vaccine is developed, we will begin to see the end of the tunnel.
| COVID-19 Case Histograms (July 08) | 7/08/2020 |
| COVID-19 Control Charts (July 08) | |
| COVID-19 Linear Regression (July 08) | |
| Table II: Student t-tests |
The fearsome trends in USA, Brazil, India, Mexico, Egypt and Israel are ominous. On the other hand, Russia, Turkey, Cyprus, and Canada are looking good.
The second wave in USA and Israel is worse than the first wave. But, India is still on its first wave, climbing ever high. The World has also not looked backward in its onward march.
While more testing is being done, we wonder how many false positives there are. Laboratory tests are of two types – (1) those that
detect a positive case (sensitivity) and (2) those that determine a negative case (specificity). So a sensitive test is more likely to
provide a false-positive result and a specific test is more likely to provide a false-negative result. 1 The problem is
compounded by
the fact that each country virtually has its own test kit – and sometimes they have many types of test kits manufactured differently.
The CDC determined that there will be more false positives than true positives when testing for antibodies against COVID. Thus, “if 2%
of people in a population have antibodies against the virus, testing them with a serologic assay with 95% specificity will result in a
positive predictive value of 26.9%, meaning there will be more false positives than true positives.” 2
We also understand that COVID is further mutating. Yet, it is still not clear how much of this is biological warfare, and how much is accidental.
Cyprus is performing well, such that the EURO MED SEC 3 conference shall be held both on-site and online. Virtual web meeting
systems using Zoom are being put in place for the technical sessions on August 04, 2020.
New Zealand has a great COVID control record. As of now, ASEA SEC 5 will definitely be held on-site, but could be held online, as
well, if travel conditions so warrant.
Closure
Not only is COVID here to stay for quite some time to come, but it is possible that as we enter the latter half of the year, the World is
going to experience many more cases than it has. So far, only 0.17% of the population has caught the virus, of which 4.5% have died.
Compare this to a 2018 TB incidence rate worldwide of 0.13% (9.9 million), of which 15% died (1.49 million). 3 By far, TB is
still a more dangerous disease worldwide than is COVID, except that TB is more concentrated in specific world areas, while COVID is widespread. The world should have exercised lockdowns for many diseases over the past decades and centuries.
1 https://www.aruplab .com/news/4-21-2020/How-Accurate-Are-COVID-19-Tests
2 https://www.medtechdive .com/news/cdc-coronavirus-antibody-testing-guidelines/578650/
3 https://www.cdc .gov/mmwr/volumes/69/wr/mm6911a2.htm
| COVID-19 Case Histograms (June 30) | 6/30/2020 |
| COVID-19 Control Charts (June 30) | |
| COVID-19 Linear Regression (June 30) | |
| Table II: Student t-tests |
While Europe and many other countries, including Thailand, Japan, Australia, and New Zealand have shown remarkable results, the World as a whole is not doing well enough. The Student t-tests that we do show that the World isn’t improving, while India is definitely getting worse.
The case can be made that Saudi Arabia, Pakistan and Egypt – all relatively populous countries, are doing better. While Bangladesh and Philippines aren’t getting worse, they’re not getting much better, either.
The USA and Israel have gotten onto a second wave that is worse than the first wave; and India appears to reach new highs every two days.
In USA, the states bordering Mexico have led the new wave. Thus, CA, AZ, and TX are the worst hit, as is FL. The reason could well be attributed to their border and proximity to Mexico, which still ranks high in the world in daily cases and total cases.
Cyprus is performing well, such that the EURO MED SEC 3 conference shall be held both onsite and online. Virtual web meeting
systems are being put in place for the technical sessions on August 04.
Closure
Despite all the interference from COVID, EURO MED SEC 3 has published its proceedings in open access, available at https://www.isec-society.org/isec_press.php. The Detailed Technical and Presentation Program for EURO MED SEC 3 has also been posted on the web at https://www.isec-society.org/EURO_MED_SEC_03/techprogram.php.
There is strong evidence that social distancing, hand washing, and wearing masks continue to be the best strategies for prevention from COVID.
| COVID-19 Case Histograms (June 23) | 6/23/2020 |
| COVID-19 Control Charts (June 23) | |
| Table II: Student t-tests |
Cyprus has very few cases, a number that is very manageable. We are waiting to hear of the new travel rules on July 01.
The World, as a whole has more cases per day these past five days than in any similar period before. Brazil, USA, and India are leading the charge. The USA and Israel have a prominent second wave.
The Rate of Infection (R0) for COVID stands at anywhere from 1.4 to 3.5. In comparison, the common flu has an R0 of 1.3. The
R0 has to fall below 1.0 for the disease to disappear. This happens when the (a) the populace develops herd immunity, (b) the populace obtains a vaccine, (c) the virus dies of its own accord, or (d) the populace takes fantastic social distancing precautions.
In March and April, Western Europe was most prominent in the daily cases. Now the top 15 are Brazil, Argentina, Chile, Peru, Colombia, and Mexico -- Bangladesh, India, Pakistan, Iran, Iraq, and Saudi Arabia -- Russia, South Africa – and USA.
The Ratio of the Average New Cases of Recent Five Days to Max Daily Peak is given in Table 1.
Student t-tests comparing performance of the last six days to the three highest peaks for The World, Brazil, India, and Mexico are not doing well (Table II)
Control Charts for USA and Israel have broken through the average line to a worse situation. A second wave is quite obvious from the charts. Hawaii also is exhibiting a second wave, though the performance of Hawaii is the best of all states in cases per million population and deaths per million population.
Closure
We are eagerly watching the situation around the world for news regarding travel, starting July 01. EURO MED SEC 3 is working hard towards offering the conference online.
| COVID-19 Case Histograms (June 18) | 6/18/2020 |
| COVID-19 Control Charts (June 18) | |
| Table II: Student t-tests |
Cyprus has very few cases, a number that is very manageable. Cyprus opened travel with 12 countries for the flwg categories with effect from June 08:
It is generally expected that travel will see restrictions lifted for many other countries on July 01. ISEC Society is monitoring the situation and will correspondingly inform its EURO MED SEC 3 conference attendees.
While the UK, USA, and Russia are slowly grinding down in its daily cases, Brazil, India, and Egypt are seeing new daily highs. The World is on an upward trend in daily cases. This upward trend is led by the BRICS countries, neighbors in South Asia from Bangladesh-India-Pakistan-Iran-Iraq-Saudi Arabia, and Brazil, Argentina, Chile, Peru, Colombia, and Mexico.
China, Israel, and Hawaii are evidently are going through a minor, second wave.
New Zealand, our location for ASEA SEC 5, is doing exceptionally well!
Modified Control Chart’ Analysis
- While Russia (7,800 daily new cases) actually came below the control line, the USA (28,000 new daily cases), Israel (253 daily new cases), and Hawaii (18 daily new cases) went higher for a couple of days. Needless to say, the number of cases is vastly different in these countries and regions.
- Brazil, India, and Egypt are bucking desirable trends.
Regression and Declination
- Since formal regression stops working effectively when cases are either very high (eg., USA) or very low (eg., Spain), we prefer to use declination rate from the highest peak to the last minor peak. The USA is now declining at an estimated 225 cases per day, at which rate it will reach close to zero around October 20. Spain is declining at 92 cases a day, and will reach close to zero by Sept 16.
- Countries for which we did regression last time have no further changes to the projection.
Table I
- Table I corroborates and confirm the control chart analysis.
Student t-tests
- The World, Brazil, India, and Egypt are still around here they were – daily cases rising.
Closure
We are waiting to learn from Cyprus of their new travel policy before we can buy travel tickets for EURO MED SEC 3.
| COVID-19 Case Histograms (June 13) | 6/13/2020 |
| COVID-19 Control Charts (June 13) | |
| COVID-19 Linear Regression (June 13) | |
| Table II: Student t-tests |
Europe seems to be nearly out of the crisis and North America is showing determination to get out of it, even as the total world cases continue to rise. Latin America and South Asia are the new countries contributing to the increased COVID cases. The BRICS countries are presently hit hard. Israel and the State of Hawaii are seeing a minor second wave.
Projected Dates Based on Regressing Peak values
On regressing the peak values, we find the projected end dates as below for four major countries:
| Projected Date |
Average Wave Period |
|
| UK | June 22 | 6 days |
| Spain | close to end | 6 days |
| France | June 19 | 7 days |
| Russia | Oct 04 | 7 days |
USA’s declining rate has decreased, perhaps owing to the massive demonstrations or perhaps owing to the partial reopening.
Modified Control Chart’ Analysis
- Russia is on the border.
- Israel and Hawaii have an upturn.
- The rest of the countries are displaying the same trends as last time – good and bad, as the case may be.
Table I
- The World, USA, UK, Brazil, India, and Hawaii are not better of tan at the last report.
Student t-tests
Student t-test results are given in Table II attached.
- Canada seems to be out of the main trouble
- The World, Brazil, India, and Egypt aren’t looking good.
Closure
Total World cases continue to climb, even as Europe, Japan, Thailand climb down. Qatar and Kuwait which ranked high on the total case per million population are slowly recovering. But the entire region from Saudi Arabia, Iran, Pakistan, India, and Bangladesh need to be closely watched. We want to hope that the stars will realign after June 30.
| COVID-19 Case Histograms (June 08) | 6/08/2020 |
| COVID-19 Control Charts (June 08) | |
| COVID-19 Linear Regression (June 08) | |
| Table II: Student t-tests |
Cyprus announced a reopening schedule for air travel. And, Europe is beginning to see restriction pressures ease.
But, still of concern are Brazil, Chile, and Peru in Latin America; and Bangladesh, India, Pakistan in South Asia. The highest incidents per million population are still in Qatar, Bahrain, and Kuwait. The highest death rates belong to Europe, though COVID is on the decline in Europe.
New Zealand announced itself COVID-free because it had moved quickly to seal off its island nation from foreign travel.
India could have 15,000 cases/day by mid-June; 30,000 cases/day by end-June; and 55,000 cases/day by mid-July. India is a time bomb given its massive population, hundreds of millions of poor, and inadequate health facilities in rural areas. Perhaps the greatest fear is what the massive unemployment can do to people if they run out of money to buy food.
USA and Russia are declining relatively slowly; Israel has gone through a small second wave; the world continues to rise inexorably – which can’t be a good sign for the burden on health care. In one sense, the reopening of industries and travel might ensure that cases will remain at a muted level for many months to come. But, people have to live, and need jobs to buy food and medicine.
Projected Dates Based on Regressing Peak values
On regressing the peak values, we find the projected end dates as below for three major countries:
| Projected Date |
Average Wave Period |
|
| UK | June 18 | 7 days |
| Spain | June 09 | 6 days |
| France | June 17 | 7 days |
The new declining rate for USA is 443 cases/day. This indicates that USA will approach zero cases by July 21.
Modified Control Chart’ Analysis
- Russia is still on the wrong side of the chart
- Brazil, India, and Egypt are not showing recovery
- Israel shows evidence of a small second wave
- USA has a volatile expression, but its recent points are on the better side of the chart
- Canada, Turkey, and Cyprus display well.
Table I
- India and Egypt are looking as the worst and 2nd-worst, respectively.
- The world is also in dire straits.
Student t-tests
Student t-test results are given in Table II attached.
- We really are worried for India, Egypt, Brazil, and the World having worrisome and adverse trends.
Closure
We have to await the results after reopening of air travel, especially in Europe. The world has reached an advanced stage of success after battling the COVID virus, but the battle isn’t finished. The battle has entered a difference phase.
| COVID-19 Case Histograms (June 03) | 6/03/2020 |
| COVID-19 Control Charts (June 03) | |
| COVID-19 Linear Regression (June 03) | |
| Table II: Student t-tests |
While Europe is well on the path to recovery, COVID events are getting worse in other world regions, as well as the world, as a whole.
World daily cases are on a continual rise since two months of about 0.67% day on day. The emerging countries of Brazil and India are emerging in COVID, as well.
The new centers for highest daily cases are Latin America and the belt in South Asia from Bangladesh to Iran and Saudi Arabia. The top 12 in daily new Cases are Brazil, USA, India, Russia, Chile, Pakistan, Peru, Mexico, Iran, Bangladesh, Sweden, and Saudi Arabia
However, the top incidence rate in deaths is centered in Europe. Nine of the top twelve such countries are in Europe, followed by USA and Canada. The top 12 in Deaths / 1M pop are Belgium, UK, Spain, Italy, Sweden, France, Netherlands, Ireland, USA, Switzerland, Canada, Ecuador
However, neither deaths nor new daily cases are the same as the maximum infection rate. The cluster of Bahrain, Qatar, and Kuwait have the highest infection rate in the world, followed by five countries in Europe. The top 12 in Total Cases / 1M pop are Qatar, Bahrain, Kuwait, Luxembourg, Singapore, Spain, Chile, USA, Peru, Iceland, Ireland, and Belgium
Other nice clusters are Australia and New Zealand where people can now travel between these two countries. North East Europe of Latvia, Lithuania and Estonia also have COVID-free travel opened up. Greece, Cyprus, and Israel are another positive cluster where travel between these countries is opening June 08.
Projected Dates Based on Regressing Peak values
On regressing the peak values, we find the projected end dates as below for three major countries:
| Projected Date |
Average Wave Period |
|
| UK | June 18 | 7 days |
| Russia | Aug 14 | 7 days |
The other countries in Europe do not have disturbing trends anymore. The crisis in Europe is more or less at an end, even in the severely hit countries such as Belgium. The only exceptions are countries on the fringes such as Belarus that have scoffed at safety measures.
The projected date for USA is calculated by determining the decline rate from peak till today, which amounts to 460 cases/day. This indicates that USA will approach zero cases by July 16. Not bad for a country that has had the maximum cases in the world.
Modified Control Chart’ Analysis
- Russia has caught up magnificently
- Israel’s minor surge needs to be watched.
- USA, Turkey, Canada, and Cyprus are doing well.
- Brazil, India, and Egypt are on the wrong side of the control chart.
Student t-tests
Student t-test results are given in Table II attached.
- We really are not worried about France and USA declining convincingly.
- India, Egypt, Brazil, and the World have worrisome and adverse trends.
Closure
The world is opening up with success. The riots in USA are irrespective to COVID, and should soon be over, though all lives matter.
We are waiting with expectation for better news from around the world by the middle of the month and definitely by July 01.
| Notice: The COVID-19 report on this page will henceforth only be published once every five days. Best wishes and stay safe. |
6/02/2020 |
| COVID-19 Cases (May 29) | 5/29/2020 |
| COVID-19 Control Charts (May 29) | |
| COVID-19 Linear Regression (May 29) | |
| Table II: Student t-tests |
Cyprus is going to restart air travel from June 08. We have learned of attendees already planning to attend the EURO MED SEC 3
conference in early August.
Please note that the world will likely have to earn to live with small amounts of COVID for a year
to come, if not 2-3 years. The world economy and the livelihood of people cannot be put on hold for a mild intensity of COVID that has
the same dangers as influenza and common cold. It’s coming to the stage that fatalities from road accidents will exceed fatalities from
COVID. The harmful effects of air pollution on health, and pesticides on farm products, sugar in soft drinks, and hormones and
antibiotics in meat products likely exceed the harmful effects by mild COVID in the community. But, people still won’t stop driving
cars or eating and drinking bad foods. Likewise, neither should people put their lives on hold for COVID. It is advised that people
should take steps to build up their immunity by natural means rather than be overly worried about COVID.
The success by dozens
of countries in Europe is remarkable.
Projected Dates Based on Regressing Peak values
On regressing the peak values, we find the projected end dates as below for three major countries:
| Projected Date |
Average Wave Period |
|
| Spain | June 06 | 6 days |
| France | June 04 | 5 days |
| Italy | Any day now | 7 days |
The projected date for USA is calculated by determining the decline rate from peak till today, which amounts to 400 cases/day. This indicates that USA will approach zero cases by July 31. Not bad for a country that has had so many cases. Of course, this is depending on no untoward surges or second waves.
Modified Control Chart’ Analysis
The story has not changed much since our last effort:
- Though Russia is still on the bad side of the control line, its trajectory is unambiguously downward. We fully expect Russia to emerge just as the Western European countries have.
- Israel’s minor surge needs to be watched.
- USA, Turkey, Canada, and Cyprus are doing well.
- Brazil, India, and Egypt are bucking trends in the other countries. They each have unusual and unique circumstances, so there isn’t just one reason for each of them. But, they are a part of the BRICS group of countries, which makes one wonder why those countries have been affected so much at this late stage.
Student t-tests
Student t-test results are given in Table II attached.
- USA, Russia, France, and Canada have recovered remarkably. In fact, we are inclined to discontinue analysis on Student t-test analysis on Russia and USA.
- India, Egypt, Brazil, and the World are lagging, as before.
Closure
We think our next milestone to watch is June 15, after countries have opened up much more than at present. But, once again, the prognosis for the next three months appears more reliable than later in the year.
| COVID-19 Cases (May 26) | 5/26/2020 |
| COVID-19 Control Charts (May 26) | |
| COVID-19 Linear Regression (May 26) |
Cyprus and New Zealand continue to look well. People to Cyprus can travel directly from Germany, Israel, and Greece. In due course, we expect other origins to open for travel to Cyprus.
Australians can freely travel back and forth from New Zealand, without quarantine, after July 01.
Whereas, Western Europe is emerging very convincingly and confidently from the COVID crisis, India, Brazil, Peru, Chile, and Egypt continue to disappoint. The World’s 5-day moving average trendline for daily cases is on a generally upward trajectory.
We find that the major countries in Western Europe – Germany, Italy, Spain, Belgium, Switzerland, Netherlands, and Ireland – have quite recovered – which is why we discontinued their statistical analysis to conserve effort. However, we are still watching UK, even as the UK is showing tremendous improvement.
Table I and the Student t-tests both corroborate each other.
Three Perspectives
We are going to look at COVID data from three perspectives today, in descending rank order of severity for the top 15 significant countries in each category:
- Ranking of daily new cases -- USA, Brazil, Russia, India, Peru, Chile, Mexico, UK, Saudi Arabia, Iran, Qatar, Pakistan, Bangladesh, Colombia, Turkey
- Ranking of total cases/million population - Qatar, Luxembourg, Spain, Singapore, Bahrain, Kuwait, Iceland, USA, Ireland, Belgium, Chile, Belarus, Peru, UK, Italy
- Ranking of total deaths/million population -- Belgium, Spain, UK, Italy, France, Sweden, Netherlands, Ireland, USA, Switzerland, Ecuador, Luxembourg, Canada, Portugal, Brazil
Each of the above perspectives gives different assessments for which countries are the worst hit. Whereas, USA is the highest in daily new cases, it is relatively lower down in other indexes. Qatar is nowhere in deaths, but ranks the highest in total cases per million population. Belgium and Spain don’t figure in the first two categories, but have the highest death rate. Whereas Brazil is high in daily cases, it ranks far lower in deaths, and nowhere in total cases per million. Likewise, India is high only in daily cases, but has a very lower per capita case rate or death rate. Hence, in judging which country is the “worst hit,” one has to assess multiple indexes.
Among the daily cases, the connected geographical chain in southern Asia and West Asia are the worst hit: Bangladesh, India, Pakistan, Iran, Turkey, and Qatar and Saudi Arabia. In addition, Brazil, Colombia, Peru, and Chile are neighbors. Then USA and Mexico are neighbors. Russia is an outlier. But this shows that daily new cases are connected via international borders.
The death rate is highest in Europe – Belgium, Spain, UK, Italy, France, Sweden, Netherlands, Ireland, Switzerland, Luxembourg, and Portugal. These were the countries hit first after China, so they either had the least tie to prepare or something is characteristic with the immunity there. USA, Canada, Brazil, and Ecuador make up the rest.
For total cases per million, we have a cluster of Qatar, Bahrain and Kuwait; in Europe, they are Luxembourg, Spain, Belgium, Italy, and UK, Ireland, and Iceland; and in Latin America, there are Chile and Peru.
Hence, there is evidence that proximity of borders affects COVID outbreak intensity and seriousness.
Projected Dates Based on Regressing Peak values
On regressing the peak values, we find the projected end dates as below for three major countries:
| Projected Date |
Average Wave Period |
|
| Spain | June 05 | 6 days |
| Russia | July 14 | 6 days |
| Italy | May 28 | 7 days |
The projected date for UK remains unchanged.
Modified Control Chart’ Analysis
The story has not changed much since our last effort:
- USA, Turkey, Canada, Israel, and Cyprus are really performing well
- Russia is beginning to catch up, and has been on a steady decline for the past two weeks, if we can believe their reports.
- Brazil, India, and Egypt appear as if they are on very shaky ground. They are all important regional countries.
Student t-tests
- USA, Canada, France, and Russia have recovered remarkably.
- India, Egypt, and the World are lagging.
Confidence of last 6 days average daily cases being lower than the three highest peaks
| Apr 20 | Apr 22 | Apr 24 | Apr 27 | Apr 29 | May 01 | May 05 | May 08 | May 15 | May 19 | May 22 | May 26 | |
| n1+n2=8 | n1+n2=8 | n1+n2=9 | n1+n2=9 | n1+n2=9 | n1+n2=9 | n1+n2=9 | n1+n2=9 | n1+n2=9 | n1+n2=9 | n1+n2=9 | n1+n2=9 | |
| World | -- | -- | -- | -- | -- | 95% | 99% | 90% | 90% | 80% | 79% | 80% |
| Brazil | 80% | 90% | 80% | <80% | 80% | 70% | 75% | 76% | 79% | 64% | 70% | 90% |
| Canada | <80% | <80% | 70% | 80% | 99% | 95% | 70% | 79% | 99.5% | 99.5% | 99.9% | 99.9% |
| France | 95% | 99.95% | 99.5% | 99.5% | 99.5% | 99.5% | 99.5% | 99.5% | 99.5% | 99.5% | 99.5% | 99.9% |
| India | -- | -- | -- | -- | -- | -- | -- | 69% | 73% | 68% | 78% | 69% |
| Egypt | -- | -- | -- | -- | -- | -- | -- | -- | -- | 63% | 73% | 77% |
| Russia | -- | -- | -- | -- | -- | -- | -- | 59% | 80% | 99.5% | 99.99% | 99.99% |
| USA | 99% | 99% | 80% | 80% | 80% | 95% | 95% | 99.95% | 99.95% | 99.95% | 99.95% | 99.95% |
Closure
The new date-to-look-for is June 15, when the results of the initial opening will be re-assessed by countries worldwide. The world literally has a 2-3 week outlook these days, and there is always a possibility of an inflamed political and military change from the status quo somewhere or the other, especially where large countries are concerned. Nevertheless, we are hopeful that things will be even better in July.
| COVID-19 Cases (May 22) | 5/22/2020 |
| COVID-19 Control Charts (May 22) | |
| COVID-19 Linear Regression (May 22) |
Cyprus and New Zealand both had zero cases today. With airline flights reopening steadily, we are inclined to look favorably at the near future.
We are only worried now of Latin and Central American countries, and South Asia. BRICS countries have a certain commonality in that COVID is in bad shape in all those countries. The virus originated in China, which was bad enough; India appears to reach a new high every 3-4 days; Russia started to spike after Europe had declined, appears to have just recently gone over the hill, and Putin wants to reopen Russia for psychological reasons, which is welcome for economic reasons, though could be bad for spreading the virus further; Brazil may soon overtake USA in daily cases; while South Africa is also seeing surges, though the total number of cases are low, which may simply be owing to lack of testing abilities.
One-half percent of the US population has contracted COVID (Rank 10 for number of cases per million population); UK is not far behind (Rank 20).
The neighbor countries of Cyprus – Israel, Greece, and Turkey are nearly recovered; Lebanon has seen a surprise surge.
The Western European countries are not much of a cause for concern anymore for reopening the economy. God help Brazil, India, and Egypt. The World cases are also surely rising, as evident by the 5-day moving average of daily cases.
Australia’s cases are down to below 20 daily cases since the last month. This represents only 0.0008% of the population catching the virus on a daily basis. Compare this to 10% of the population that catch the influenza/flu in any season, yielding 0.11% of the population catching influenza/flu every day. Hence, the likelihood of catching COVID in Australia is 1,375 times less than catching influenza/flu in normal times.
Projected Dates Based on Regressing Peak values
On regressing the peak values, we find the projected end dates as below for three major countries:
| Projected Date |
Average Wave Period |
|
| Spain | June 06 | 6 days |
| UK | June 22 | 7 days |
| Russia | June 18 | 3 days |
Modified Control Chart’ Analysis
- We hope that Russia will come below its own operating average, since it is showing signs of doing so.
- USA, Turkey, Canada, Israel, and Cyprus are really performing well
- Brazil, India, and Egypt are defying gravity.
Student t-tests
- Russia is showing substantive statistical improvement; Brazil, India and Egypt are still bad.
- Canada, France, and USA are steady and doing quite well.
Confidence of last 6 days average daily cases being lower than the three highest peaks
| Apr 20 | Apr 22 | Apr 24 | Apr 27 | Apr 29 | May 01 | May 05 | May 08 | May 15 | May 19 | May 22 | |
| n1+n2=8 | n1+n2=8 | n1+n2=9 | n1+n2=9 | n1+n2=9 | n1+n2=9 | n1+n2=9 | n1+n2=9 | n1+n2=9 | n1+n2=9 | n1+n2=9 | |
| World | -- | -- | -- | -- | -- | 95% | 99% | 90% | 90% | 80% | 79% |
| Brazil | 80% | 90% | 80% | <80% | 80% | 70% | 75% | 76% | 79% | 64% | 70% |
| Canada | <80% | <80% | 70% | 80% | 99% | 95% | 70% | 79% | 99.5% | 99.5% | 99.9% |
| France | 95% | 99.95% | 99.5% | 99.5% | 99.5% | 99.5% | 99.5% | 99.5% | 99.5% | 99.5% | 99.5% |
| India | -- | -- | -- | -- | -- | -- | -- | 69% | 73% | 68% | 78% |
| Egypt | -- | -- | -- | -- | -- | -- | -- | -- | -- | 63% | 73% |
| Russia | -- | -- | -- | -- | -- | -- | -- | 59% | 80% | 99.5% | 99.99% |
| USA | 99% | 99% | 80% | 80% | 80% | 95% | 95% | 99.95% | 99.95% | 99.95% | 99.95% |
Notes: Conf = Confidence
Table I
Compared to the last report, USA, UK, Russia, India, Cyprus are in a steady band; Brazil, Egypt, and the World are getting worse, and this is a cause of concern and worry.
Closure
We need to keep our hopes alive! Stay safe still. It appears that the next milestones to watch out for are June 01, June 15, and June 30. Viruses work in mysterious ways, since not everything of them is fully understood. The virus may disappear for a few months in July-August-Sept just as easily as it came about in Jan-Feb-Mar. In many ways, the upcoming 3-4 months are more predictable than early next year.
Article from Cyprus Mail
Coronavirus: no new cases, first time since March 9 (Update 2): https://cyprus-mail.com/2020/05/23/coronavirus-no-new-cases-on-saturday/| COVID-19 Cases (May 19) | 5/19/2020 |
| COVID-19 Control Charts (May 19) | |
| COVID-19 Linear Regression (May 19) |
It is relieving to observe that Cyprus and New Zealand, our two destinations for conferences this year, are really doing very well. In both countries, the daily cases
have been down to a trickle of 0 to 4, while deaths have been under 2%. We are excited that Cyprus and its neighbor, Greece, are reopening for tourism. This works
very well for the EURO MED SEC 3 conference.
Other island destinations, such as Bali and Iceland, are also reopening for tourism, which is a major portion
of their economy. See https://nypost
.com/2020/05/18/cyprus-iceland-greece-begin-reopening-even-to-tourists/.
Indeed, we can hardy expect people to
remain cooped up in fear in their homes: they all have a basic need to get out and live normal lives. So now, all the major countries of Europe have exhibited a
definite decline in daily cases and are beginning to reopen very positively.
That said, we remain fearful of Brazil, India, and Egypt. The cases in those
countries continue to skyrocket. Brazil has gone somewhat “herd,” and is allowing the immunity to spread. But, in so doing, the deaths and suffering are also
substantial: the deaths are at 6% of the total cases so far.
India’s situation has been frightening, where the poor slum areas are the worst hit. If the current growth rate in distinct peak values of 4% a day of the past two weeks continues unabated into the future, then by July 15 India could have as many total cases as USA has now. We can only hope that the high temperatures above 40 degrees C in the subcontinent will kill the virus, but we are still waiting for real evidence towards that. The annual ‘heat wave’ in and around New Delhi, for instance, started around May 12, to be followed in early July by the welcome but debilitating monsoons.
The world continued to display a rising trend, which is disturbing. While the Western economies are recovering, other countries are showing up with high daily cases – Brazil, India, Peru, Russia, Chile, Mexico, Saudi Arabia …
However, we are happy to see the steady declines in Russia since May 1, and Turkey since April 11. There is hope for the world on this count.
Projected Dates Based on Regressing Peak values
On regressing the peak values, we find the projected end dates as below:
| Projected Date |
Average Wave Period |
|
| Italy | May 26 | 7 days |
| Spain | June 09 | 6 days |
| UK | June 25 | 7 days |
| Russia | June 24 | 4 days |
| Cyprus | any day now | 6 days |
Modified Control Chart’ Analysis
- Russia, Brazil, India, Egypt are on the wrong side of the control line
- Israel, Cyprus, Hawaii are on the good side
- USA, Canada, and Turkey are stabilizing very well and are now on the good side. The drawback of USA is the large numbers of daily cases that will take time to whittle down
Student t-tests
- Russia is showing statistical improvement; Brazil, India and the World are worse since the last report.
- Egypt has a poor record.
- Canada, France, and USA are steady.
Confidence of last 6 days average daily cases being lower than the three highest peaks
| Apr 17 | Apr 20 | Apr 22 | Apr 24 | Apr 27 | Apr 29 | May 01 | May 05 | May 08 | May 15 | May 19 | |
| n1+n2=8 | n1+n2=8 | n1+n2=8 | n1+n2=9 | n1+n2=9 | n1+n2=9 | n1+n2=9 | n1+n2=9 | n1+n2=9 | n1+n2=9 | n1+n2=9 | |
| World | -- | -- | -- | -- | -- | -- | 95% | 99% | 90% | 90% | 80% |
| Brazil | <80% | 80% | 90% | 80% | <80% | 80% | 70% | 75% | 76% | 79% | 64% |
| Canada | 80% | <80% | <80% | 70% | 80% | 99% | 95% | 70% | 79% | 99.5% | 99.5% |
| France | 95% | 95% | 99.95% | 99.5% | 99.5% | 99.5% | 99.5% | 99.5% | 99.5% | 99.5% | 99.5% |
| India | -- | -- | -- | -- | -- | -- | -- | -- | 69% | 73% | 68% |
| Egypt | -- | -- | -- | -- | -- | -- | -- | -- | -- | -- | 63% |
| Russia | -- | -- | -- | -- | -- | -- | -- | -- | 59% | 80% | 99.5% |
| USA | 95% | 99% | 99% | 80% | 80% | 80% | 95% | 95% | 99.95% | 99.95% | 99.95% |
Notes: Conf = Confidence
Table I
Compared to the last report, Brazil is doing worse, while Egypt is about the same. All other countries in the Table are doing better.
Closure
The various statistical analyses confirm and corroborate each other, thereby confirming that the conclusions are well established.
While the Western world is recovering, other countries are coming up with more cases than ever before.
Our conference destinations for this year – Cyprus and New Zealand – both island nations – are doing very well. We are optimistic about holding our conference in those places.
| COVID-19 Cases (May 15) | 5/15/2020 |
| COVID-19 Control Charts (May 15) | |
| COVID-19 Linear Regression (May 15) |
Cyprus is performing with excellence! Countries around the world are beginning to reopen their hundreds of the more important daily activities with caution, and that is a positive sign.
What is somewhat worrying is that Russia and India continue to reopen even though their performance is not in the clear by any analytical tool we have adopted here. The Presidents of Brazil and Belarus continue to thumb their nose at COVID. We don’t believe this is wise, though Belarus is a small country and may wash over the virus quite soon.
What took us by surprise was that after the USA, which is doing more testing than any other country, by far, Russia, Brazil, India, and UK – in that order – became the 2nd, 3rd, 4th, and 5th in rank order for daily COVID cases. Worldometer gave the following data for those top five countries:
| Country | Daily Cases |
| USA | - 22,802 |
| Russia | - 10,899 |
| Brazil | - 8,459 |
| India | - 3,524 |
| UK | - 3,403 |
The charts of daily cases attached show the data for the World. Alarmingly, the five-day trendline for the world shows a steady increase in daily cases since April 01.
We also note that flights are operating in the USA, although with safety measures in place. For all essential travellers, this is a blessing.
Projected Dates Based on Regressing Peak values
On regressing the peak values, we find the projected end dates as below:
| Projected Date |
Average Wave Period |
|
| Italy | May 24 | 7 days |
| Spain | June 12 | 7 days |
| France* | May 27 | 5 days |
| India | June 25 | 4 days |
| Cyprus | any day now | 6 days |
*: Lognormal regression
Italy is likely to emerge out of the crisis faster than its neighbor, Spain. We already discontinued analysis for Switzerland, Austria, and Germany because we estimate they are notably out of the woods, or close to the exit.
USA is declining by an average of 200 cases per day. At this rate, it will take till September 27, 2020 for the cases to approach zero.
Modified Control Chart’ Analysis
We consider this chart as our most powerful and informative analytical tool at the present time. This chart is what I would recommend Presidents and decisions makers to go by.
- Brazil, India, Egypt, and Russia appear spiraling out of control in the wrong direction.
- Cyprus, Israel, and Turkey are really doing well.
- USA and Canada display a slow decline, which is positive, nevertheless.
- Hawaii is coming in with 1 to 3 cases a day for the past 10 days.
Student t-tests
The way our Student t-tests work is to compare the past six days results with the three highest peaks. Hence, the past six days days' data might include a peak or two. So, it is quite obvious that the average of the past 6-days will be less than the average of the three peaks. In addition, taking an average over six days will smooth the recent trend. Obviously, the last six days represents the performance of the recent days. Consequently, the higher the confidence in the difference, the easier can we say that the differences of the current trend from the peaks are significant.
Today’s analysis reconfirms what the control charts are showing: Brazil, India, and Russia continue to be in a tough spot, much as last week. Canada and USA are improving. The World is steady, which is both good news and bad news! But the confidence in the difference is down this week from the first week of May.
Confidence of last 6 days average daily cases being lower than the three highest peaks
| Apr 15 | Apr 17 | Apr 20 | Apr 22 | Apr 24 | Apr 27 | Apr 29 | May 01 | May 05 | May 08 | May 15 | |
| n1+n2=8 | n1+n2=8 | n1+n2=8 | n1+n2=8 | n1+n2=9 | n1+n2=9 | n1+n2=9 | n1+n2=9 | n1+n2=9 | n1+n2=9 | n1+n2=9 | |
| World | -- | -- | -- | -- | -- | -- | -- | 95% | 99% | 90% | 90% |
| Brazil | <80% | <80% | 80% | 90% | 80% | <80% | 80% | 70% | 75% | 76% | 79% |
| Canada | 99% | 80% | <80% | <80% | 70% | 80% | 99% | 95% | 70% | 79% | 99.5% |
| France | 95% | 95% | 95% | 99.95% | 99.5% | 99.5% | 99.5% | 99.5% | 99.5% | 99.5% | 99.5% |
| India | -- | -- | -- | -- | -- | -- | -- | -- | -- | 69% | 73% |
| Russia | -- | -- | -- | -- | -- | -- | -- | -- | -- | 59% | 80% |
| USA | 99.5% | 95% | 99% | 99% | 80% | 80% | 80% | 95% | 95% | 99.95% | 99.95% |
Notes: Conf = Confidence
Table I
Compared to a week ago, all countries in the table are better, except Brazil. This is a good indicator of declining trends, and supplements the control charts and Student t-tests. Egypt, Israel, and Cyprus are markedly better. USA and UK are plodding along.
Closure
The phased reopening appears to be in everyone’s interest. Keeping an optimistic attitude is necessary for survival.
| COVID-19 Cases (May 08) | 5/08/2020 |
| COVID-19 Control Charts (May 08) | |
| COVID-19 Linear Regression (May 08) |
Cyprus has been in the single digits for 10 days. The Cyprus President’s excellent speech on the matter of reopening is available at https://in-cyprus.philenews.com/presidents-address-on-easing-of-measures/. This speech is a must read to
really understand (a) all that is involved in the decision of reopening in any country, and (b) how difficult decision making is for Presidents and Prime Ministers.
Among the neighbors of Cyprus → Israel, Lebanon, Turkey, and Greece are doing well, we’d say; only Egypt is headed in the wrong direction.
Most parts of the world is moving for the better, such as Western Europe; but other parts, such as Russia, India, Brazil, and Bamgladesh, are on the cusp –
and could deteriorate or improve depending on how they manage the crisis. India and Bangladesh are particularly vulnerable for its millions of poor and deprived.
If the COVID is not controlled in South Asia, that region could easily see 10% of its population affected: that would mean close to 150 million people and anywhere
from 5 to 15 million deaths.
One can discover from https://www.endcoronavirus.org/countries
which countries are doing well, which are in the middle, and which are in hot waters. It’s the moving day average plotted on the daily case histograms that makes all the difference to discern the patterns. We observe that we started marking the 5-day moving average on the daily case histogram before Worldometer did, and before the graphs came out in the link above. A simple matter of plotting the moving average escaped many a group for a long time. Hence, we definitely did something right on time.
USA and UK cases are declining, but not at the slope we’d like to see, and appear quite horizontal for statistical purposes. But, that said, the world is eager to open up the dashed economy everywhere, else the aftermath could be worse than the disease. If unemployment continues at a high rate, we could see strikes, demonstrations, upheavals, and civil strife, not to mention the overthrow of governments. As it is, Lebanon is an example of what could happen to a country when the perfect storm hits.
The summer heat should help incapacitate the protein core in the virus, especially in India and Bangladesh where summer temperatures hit 40 degrees Centigrade. So, the period from 15 May to 30 June in India and Bangladesh, when it is the hottest before the onset of monsoon rains in July, can see a tremendous reduction in daily cases.
But, we look optimistically at the phased plan of reopening set by all governments.
Projected Dates Based on Regressing Peak values
On regressing the peak values, we find the projected end dates as below:
| Projected Date |
Average Wave Period |
|
| Italy | May 20 | 8 days |
| Spain | June 14 | 7 days |
| Germany | May 11 | 7 days |
| Switzerland | any day now | 6 days |
| France* | May 16 | --- |
| Cyprus | any day now | 6 days |
*: Lognormal regression
The ideal way to project is to use multiple models and create a portfolio of the ensuing end dates. From this portfolio of dates, it is a prudent measure to use some statistic, such as the mean value or one with a 75% confidence, etc. For France, we created four projection scenarios. For France, It is sensible to look at the 3rd week of May or end-May to reach to an acceptable minimum of daily cases. But, we need an army of resources to undertake heavy statistical analysis.
Please note that it is somewhat difficult to expect that daily cases will reach zero. The fact is that the world will have to live with a minimum number of cases, much as it lives with tuberculosis, typhoid, the Nile virus, and influenza and pneumonia.
Modified Control Chart’ Analysis
We focused our Modified Control Chart Analysis on countries that are still emerging from the COVID crisis.
- Brazil, India, Egypt, and Russia appear spiraling out of control in the wrong direction. The world has to be wary of these countries.
- Cyprus, Israel, and Turkey are really doing well.
- USA and Canada display a very horizontal trend that is also disconcerting because one expects faster progress here.
Student t-tests
The Student t-tests reconfirm what the control charts and daily case profiles are showing: Brazil, Canada, India, and Russia are in a tough spot. The world’s resources must help them before they lose control.
USA is doing pretty well in t-test analysis of the last six days to the three peak values, but these numbers are showing the way they are because of the very high numbers of cases in USA – between 20,000 and 30,000 daily.
Confidence of last 6 days average daily cases being lower than the three highest peaks
| Apr 13 | Apr 15 | Apr 17 | Apr 20 | Apr 22 | Apr 24 | Apr 27 | Apr 29 | May 01 | May 05 | May 08 | |
| n1+n2=8 | n1+n2=8 | n1+n2=8 | n1+n2=8 | n1+n2=8 | n1+n2=9 | n1+n2=9 | n1+n2=9 | n1+n2=9 | n1+n2=9 | n1+n2=9 | |
| World | -- | -- | -- | -- | -- | -- | -- | -- | 95% | 99% | 90% |
| Brazil: | 95% | <80% | <80% | 80% | 90% | 80% | <80% | 80% | 70% | 75% | 76% |
| Canada: | 95% | 99% | 80% | <80% | <80% | 70% | 80% | 99% | 95% | 70% | 79% |
| France: | 95% | 95% | 95% | 95% | 99.95% | 99.5% | 99.5% | 99.5% | 99.5% | 99.5% | 99.5% |
| India: | -- | -- | -- | -- | -- | -- | -- | -- | -- | -- | 69% |
| Russia: | -- | -- | -- | -- | -- | -- | -- | -- | -- | -- | 59% |
| USA: | 80% | 99.5% | 95% | 99% | 99% | 80% | 80% | 80% | 95% | 95% | 99.95% |
Notes: Conf = Confidence
Table I
Table I confirms what the control charts and student t-tests are saying, albeit in a different way. They show that UK, Russia, India, and the World are worse than on May 5. Israel and Cyprus are much better by far. Hawaii is steady, having reached zero cases today.
Closure
Be wary of COVID management in Russia, Brazil, Egypt, Bangladesh, Canada, and India.
USA and UK are showing a decline, but a very slow decline. It’s the large population centers of London and New York that have virtually half the cases. The top 15 countries in Worldometer – sorted by total cases – are USA, Spain, Italy, UK, Russia (shooting up fast), France, Germany, Brazil (shooting up fast), Turkey, Iran (can’t believe their data), China (can’t believe their data), Canada, Peru, India (total cases probably under-reported), Belgium.
Nevertheless, cautious optimism and gradual reopening is the salient observation and reflection of this week.
Cyprus has been in the single digits since a week, in which time its average daily cases are 5. The President of Cyprus gave an illuminating speech, where he outlined
how the country was to reopen over the next month and beyond. Life is returning to normal in controlled phases in Cyprus. The tourist offices and tourist agents are
permitted to start working again, which is a good sign for tourists coming to Cyprus.
All of Western Europe is doing better. But, UK and USA are declining
ever so slowly. The decline of the world is significant.
However, Russia, India, Brazil, and Egypt continue to see very high peak values.
We note
that Worldometer got on to plotting 3-day moving averages for their daily cases a few days after we began to use 5-day moving averages for all our countries analyzed
. There are two patterns visible from the 5-day moving averages:
- The profile can be closely approximated by a normal distribution
- The decline is in waves.
5-Day Moving Averages
The power point slides we analyzed for the 5-day moving averages show convincingly that the incidence of daily cases resembles a normal distribution for virtually every country analyzed. France, Germany, Switzerland, Austria, Cyprus, and Israel are close to their tail end on the right side. Spain, Italy, and Turkey are slowly but surely approaching that tail end.
However, USA, UK, and the World exhibit only a start to the decline.
Russia, India, Egypt, and Brazil are the only major countries demonstrating a continued increase in daily cases.
Projected Dates Based on Regressing Peak values
On regressing the peak values, we find that the projected end dates have not changes since our last report. So, please use those values. The lack of a change is optimistic.
Regressing All Days since Peak
Cyprus and Israel hold steady with their forecast days when COVID will become minimal or zero.
Forecast Date
| Apr 9 | Apr 10 | Apr 13 | Apr 15 | Apr 17 | Apr 20 | Apr 22 | Apr 24 | Apr 27 | Apr 29 | May 01 | May 05 | |
| Cyprus: | -- | -- | -- | -- | -- | -- | May 29 | May 24 | May 20 | May 22 | May 22 | May 21 |
| Israel: | Apr 17 | Apr 21 | Apr 29 | May 12 | May 04 | May 03 | May 12 | May 14 | May 11 | May 10 | May 10 | May 09 |
Note: F'cast = Forecast; Austria and Australia use logarithmic regression; all other use linear regression.
Modified Control Chart’ Analysis
The Modified Control Chart Analysis reveals the following (slides attached):
- Brazil, Canada, and Russia are lunging upwards
- All others analyzed are behaving well, complementing their 5-day average trendline
Table I and Student t-tests
From Table I, all except Brazil are better since the last report.
Spain and Belgium were discontinued in t-test analyses owing to their success with declining numbers. The world is improving with greater confidence. But, Canada and Brazil continue to be taken over the coals.
Confidence of last 6 days average daily cases being lower than the three highest peaks
| Apr 13 | Apr 15 | Apr 17 | Apr 20 | Apr 22 | Apr 24 | Apr 27 | Apr 29 | May 01 | May 05 | |
| n1+n2=8 | n1+n2=8 | n1+n2=8 | n1+n2=8 | n1+n2=8 | n1+n2=9 | n1+n2=9 | n1+n2=9 | n1+n2=9 | n1+n2=9 | |
| World | -- | -- | -- | -- | -- | -- | -- | -- | 95% | 99% |
| Brazil: | 95% | <80% | <80% | 80% | 90% | 80% | <80% | 80% | 70% | 75% |
| Canada: | 95% | 99% | 80% | <80% | <80% | 70% | 80% | 99% | 95% | 70% |
| France: | 95% | 95% | 95% | 95% | 99.95% | 99.5% | 99.5% | 99.5% | 99.5% | 99.5% |
| USA: | 80% | 99.5% | 95% | 99% | 99% | 80% | 80% | 80% | 95% | 95% |
Notes: Conf = Confidence
Closure
Russia, Brazil, Egypt, and India continue to buck trends that the rest of the world is witnessing. Why these major countries? We don’t know for sure, but we know that Egypt and India were major partners in the non-aligned movement; whereas Russia, Brazil, and India are together in the BRICS countries.
USA and UK have a slow and hard decline. However, we are optimistic of Western Europe, in general.
| Notice: The COVID-19 report on this page will henceforth only be published on T F. Best wishes and stay safe. | 5/02/2020 |
We received the following reports from countries neighboring Cyprus:
Egypt: Actually, the number of infected people in Egypt is low, we have 6000 total cases, with present daily increases of around the 200 to 300, the number of deaths all in all is around 400, and the number of people recovered approaches 1500. I guess everything is fine in Egypt.
... Sherine El Baradei
Israel: 80% of Israel has no cases for several days; only four cities reported more than 5 daily cases; number on ventilators down to 83. The government plans to consider opening public parks, malls and open-air markets and ending the restriction keeping the public within 100 meters from their homes. The government is also set to allow swimming in the sea and open public swimming pools. A gradual reopening of schools has been authorized
... Times of Israel
Lebanon: The COVID is nearly over; Lebanon is at the tail of its distribution; daily cases are in the single digits.
... Mohamed-Asem Abdul Malak
Turkey: The government plans to reopen shopping malls towards the end of May.
... Asli Pelin Gurgun
Cyprus: On the 29th of April, the Cyprus government announced the easement of measures related to the control of Covid-19 spread. The measures will be gradually relaxed in three phases, commencing from the 4th of May, with the opening of the construction sector and shops (excluding malls). From the 21st of May, the hospitality sector can start operating, and people will be able to visit parks, squares and other open air spaces. On the 1st of June, beaches, museums, libraries and archaeological sites open.
... Yiannis Vacanas
5-Day Moving Averages
The power point slides we analyzed for the 5-day moving averages show convincingly that the incidence of daily cases resembles a normal distribution for virtually every country analyzed. France, Germany, Switzerland, Austria, Cyprus, and Israel are close to their tail end on the right side. Spain, Italy, and Turkey are slowly but surely approaching that tail end.
However, USA, UK, and the World exhibit only a start to the decline.
Russia, India, Egypt, and Brazil are the only major countries demonstrating a continued increase in daily cases.
Projected Dates Based on Regressing Peak values
On regressing the peak values, we find that the projected end dates are as follows:
| Projected Date |
Average Wave Period |
|
| Switzerland | May 05 | 6 days |
There was no change for the other countries from the last report. However, the plots of France and Cyprus were revised.
Regressing All Days since Peak
Cyprus and Israel hold steady with their forecast days when COVID will become minimal or zero.
Forecast Date
| Apr 9 | Apr 10 | Apr 13 | Apr 15 | Apr 17 | Apr 20 | Apr 22 | Apr 24 | Apr 27 | Apr 29 | May 01 | |
| Cyprus: | -- | -- | -- | -- | -- | -- | May 29 | May 24 | May 20 | May 22 | May 22 |
| Israel: | Apr 17 | Apr 21 | Apr 29 | May 12 | May 04 | May 03 | May 12 | May 14 | May 11 | May 10 | May 10 |
Note: F'cast = Forecast; Austria and Australia use logarithmic regression; all other use linear regression.
Modified Control Chart’ Analysis
The Modified Control Chart Analysis reveals the following (slides attached):
- Brazil, Canada, and Russia are lunging upwards
- All others analyzed are behaving well, complementing their 5-day average trendline
Table I and Student t-tests
For Table I, we narrowed our search to countries that were struggling to emerge from the crisis. Indeed, UK, Brazil, Canada, and the World slipped a bit since our last report.
The confidence results from t-tests show that Brazil is struggling the most. USA and the World are slow to recover, but that may be largely because USA is 1/3rd of all World cases.
Confidence of last 6 days average daily cases being lower than the three highest peaks
| Apr 8 | Apr 9 | Apr 10 | Apr 13 | Apr 15 | Apr 17 | Apr 20 | Apr 22 | Apr 24 | Apr 27 | Apr 29 | May 01 | |
| n1+n2=8 | n1+n2=8 | n1+n2=8 | n1+n2=8 | n1+n2=8 | n1+n2=9 | n1+n2=9 | n1+n2=9 | n1+n2=9 | n1+n2=9 | n1+n2=9 | n1+n2=9 | |
| World | -- | -- | -- | -- | -- | -- | -- | -- | -- | -- | -- | 95% |
| Spain: | 99.5% | 99.9% | 99.9% | 99.9% | 99.5% | 99.5% | 99% | 99.5% | 99% | 99.5% | 99.5% | 99.99% |
| Belgium: | 95% | 99% | 90% | 80% | <80% | 80% | 80% | 99.5% | 99% | 99.5% | 99.5% | 99.99% |
| Brazil: | -- | -- | -- | 95% | <80% | <80% | 80% | 90% | 80% | <80% | 80% | 70% |
| Canada: | -- | -- | -- | 95% | 99% | 80% | <80% | <80% | 70% | 80% | 99% | 95% |
| France: | -- | -- | -- | 95% | 95% | 95% | 95% | 99.95% | 99.5% | 99.5% | 99.5% | 99.5% |
| USA: | -- | -- | -- | 80% | 99.5% | 95% | 99% | 99% | 80% | 80% | 80% | 95% |
Notes: Conf = Confidence
Closure
We fear most for Russia, Brazil, and India. Find anything common in them? They are part of the BRICS countries. Though China appears back to normal, their reported data is surprising. But, South Africa has had highs in the recent three days. Together, these five countries make up the BRICS grouping, and they all have problems.
All countries are beginning to open up. However, we fear for Russia, Brazil, and India for what will happen if they open up. But, for Europe and the Mediterranean, opening up is the logical path forward.
| COVID-19 Cases (April 29) | 4/29/2020 |
| COVID-19 Control Charts (April 29) | |
| COVID-19 Linear Regression (April 29) |
The average cases in Cyprus for the past 12 days are 7.75 cases per day. As we explained in previous reports, this incidence rate for Cyprus is lower than what causes deaths from influenza and the common cold in any season. The projected lognormal regressed date for Cyprus when all cases will become zero now is signaled at May 22, though the linear regression of peak values shows a closure by May 03. We’d rather be conservative about this. Cyprus is expected to slowly open up its activities and economy. In the first phase, they plan next week to open shops and parks, and then slowly open up other areas.
Though Australia seems so close to zero cases a day, compared to the maximum peak of 537, the daily cases are simply not becoming zero. But, considering that it took a month for Australia to reach the peak from very early March to the end of March, Australia has taken that much time – one month – to come down to its low level of an average 18 cases per day over the last 12 days. This rate is again lower than what would cause deaths from influenza and the common cold. Moreover, Australia is looking like a good normal distribution.
The total deaths to total cases are more than 10% in Spain, Italy, UK, and France, though there is always a phase lag of 9 to 31 days from onset to death, with the most commonly touted number being 11 days.
The declines in Italy, Spain, France, and UK – arguably a representative sample of the most significant countries from incident rates per million population – are showing marked trends of decline. Switzerland and Germany are continuing their noteworthy decline. Singapore also has fallen in the high group of late owing to not taking care of its immigrant workers, which is a shame.
Turkey and Russia have crept up in the list of worst-affected countries to 7th and 8th position, respectively. Russia, particularly, is struggling.
Projected Dates Based on Regressing Peak values
On regressing the peak values, occurring periodically every 4-7 days, which is characteristic of this virus, we find that the projected end dates are as follows:
| Projected Date |
Average Wave Period |
|
| Italy | May 25 | 6 days |
| Spain | July 01 | 7 days |
| Germany | May 09 | 7 days |
| Switzerland | May 03 | 6 days |
| France* | May 18 | 4 days |
| Cyprus | May 03 | 7 days |
*: Lognormal regression
Spain had a major revision from the last report owing to revisions in their data. Other countries had minor changes. Cyprus fell back to six cases today after a surge yesterday. The charts for these are attached.
Regressing All Days since Peak
We discontinued all logarithmic regression for the few remaining countries we were analyzing. Only Cyprus and Israel remain. Generally, we must choose the more sensible of (i) lognormal regression of all values since the max peak, to the (ii) values obtained by regressing only the major, periodic peaks.
Forecast Date
| Apr 5 | Apr 6 | Apr 7 | Apr 8 | Apr 9 | Apr 10 | Apr 13 | Apr 15 | Apr 17 | Apr 20 | Apr 22 | Apr 24 | Apr 27 | Apr 29 | |
| Cyprus: | -- | -- | -- | -- | -- | -- | -- | -- | -- | -- | May 29 | May 24 | May 20 | May 22 |
| Israel: | -- | -- | -- | -- | Apr 17 | Apr 21 | Apr 29 | May 12 | May 04 | May 03 | May 12 | May 14 | May 11 | May 10 |
Note: F'cast = Forecast; Austria and Australia use logarithmic regression; all other use linear regression.
Modified Control Chart’ Analysis
The Modified Control Chart Analysis reveals the following:
- Brazil, Canada, and Russia appear in trouble
- USA is in the doldrums, complemented by their 5-day moving average, which seems to be steady at about 30,000 cases per day.
- All other countries are showing desirable trends, some better than others. Of special interest to us, Cyprus is showing good results.
Table I and Student t-tests
Table I results are getting better day-by-day for every country, indicating that the number of daily cases is falling, which is what really matters.
The confidence results from t-tests are given below. Israel, Canada and Brazil have improved noticeably. We will henceforth discontinue tracking a country once it
reaches a significant difference of 99.95%, because we feel our work is statistically done by then.
Confidence of last 6 days average daily cases being lower than the three highest peaks
| Apr 5 | Apr 6 | Apr 7 | Apr 8 | Apr 9 | Apr 10 | Apr 13 | Apr 15 | Apr 17 | Apr 20 | Apr 22 | Apr 24 | Apr 27 | Apr 29 | |
| n1+n2=7 | n1+n2=7 | n1+n2=7 | n1+n2=8 | n1+n2=8 | n1+n2=8 | n1+n2=8 | n1+n2=8 | n1+n2=9 | n1+n2=9 | n1+n2=9 | n1+n2=9 | n1+n2=9 | n1+n2=9 | |
| Spain: | 90% | 95% | 95% | 99.5% | 99.9% | 99.9% | 99.9% | 99.5% | 99.5% | 99% | 99.5% | 99% | 99.5% | 99.5% |
| Belgium: | -- | 90% | 95% | 95% | 99% | 90% | 80% | <80% | 80% | 80% | 99.5% | 99% | 99.5% | 99.5% |
| Israel: | -- | -- | -- | -- | 95% | 95% | 99.5% | 99.95% | 99.5% | 99.95% | 99.5% | 99.5% | 99.5% | 99.99% |
| Brazil: | -- | -- | -- | -- | -- | -- | 95% | <80% | <80% | 80% | 90% | 80% | <80% | 80% |
| Canada: | -- | -- | -- | -- | -- | -- | 95% | 99% | 80% | <80% | <80% | 70% | 80% | 99% |
| France: | -- | -- | -- | -- | -- | -- | 95% | 95% | 95% | 95% | 99.95% | 99.5% | 99.5% | 99.5% |
| USA: | -- | -- | -- | -- | -- | -- | 80% | 99.5% | 95% | 99% | 99% | 80% | 80% | 80% |
Notes: Conf = Confidence
Closure
We hear more and more of states and countries beginning to open up. Florida, which has as many reported cases as India, is opening up major activities. The US Federal government announced that starting May 1, they will not insist on people wearing masks. It is quite possible that we will have herd immunity before the vaccine is produced.
But, we may well have to live with stray incidents of COVID for some time to come – perhaps a year or two, for sure, and then we’ll see.
| COVID-19 Cases (April 27) | 4/27/2020 |
| COVID-19 Control Charts (April 27) | |
| COVID-19 Linear Regression (April 27) |
Cyprus again had daily cases today in the single digits. The average cases were 7.2 for the past ten days. The projected lognormal regressed date for Cyprus when all cases will become zero now is signaled at May 24, which is a little better than two days ago. Cyprus has had less than or equal to 12 cases a day for 7 days in a row. This is fortunate and welcome news!
We hope Australia will become the first continent to get rid of COVID, though we have to watch out for the Fall period. Austria is also coming down fast.
The 5-day trendlines for USA, Spain, UK, and World give the impression that the cases have flattened instead of falling, which is not nice. But, Italy, France, Germany, Switzerland have a distinct downward slope.
The countries with the most cases per million population are Luxembourg, Iceland, Spain, Gibralter, Belgium, Switzerland, Ireland, Italy, and France. We can only guess why that is, without certainty, though – but we can report the facts as we get them.
France is an interesting case even though it had a surge yesterday compared to day-before. France joins Cyprus, Australia, Austria, and Switzerland in having fewer cases than would cause death by the common influenza. Hawaii was down to one case today, though the stoppage of tourism has really hurt their economy..
Worldometer, from where we source our data, often changes the values they report for various countries – 3 days to a week after reporting them. There’s nothing we can do about this except use the new data when we get it, to revise our charts. We can understand the absolute difficulty and challenge of getting accurate reports from countries, who themselves have such difficulty getting the data from hospitals and clinics in the first place.
Projected Dates Based on Regressing Peak values
On regressing the peak values, occurring periodically every 4-8 days, we find that the projected end dates are as follows:
| Projected Date |
Average Wave Period |
|
| Italy | May 25 | 6 days |
| Spain | June 15 | 7 days |
| Germany | May 12 | 7 days |
| Switzerland | May 03 | 6 days |
| France* | May 16 | 4 days |
| Cyprus | Apr 28 | 7 days |
*: Lognormal regression
Each country has its characteristic wave period, the most common of which is 7 days, which is characteristic. The charts for these are attached.
Regression Analysis and Modified Control Chart’ Analysis
We continued with logarithmic regression for the countries below. The forecast we get for when cases will become zero are given. It seems that Australia, South Korea, and Austria are going to zero out any day, now. We hope that is true, but it does appear that COVID is in its final stages in those countries, even if it drags out a little bit more. China reported zero cases for the past 10 days, from Worldometer.
Forecast Date
| Apr 5 | Apr 6 | Apr 7 | Apr 8 | Apr 9 | Apr 10 | Apr 13 | Apr 15 | Apr 17 | Apr 20 | Apr 22 | Apr 24 | Apr 27 | |
Australia: |
Apr 15 |
Apr 15 |
Apr 14 |
Apr 13 |
Apr 14 |
Apr 14 |
Apr 14 |
May 01 |
Apr 30 |
Apr 29 |
Apr 28 |
Apr 28 |
Apr 29 |
| Austria: | -- | -- | Apr 11 | Apr 12 | Apr 13 | Apr 14 | Apr 15 | Apr 26 | Apr 26 | Apr 26 | Apr 27 | Apr 27 | Apr 29 |
| Cyprus: | -- | -- | -- | -- | -- | -- | -- | -- | -- | -- | May 29 | May 24 | May 20 |
| Israel: | -- | -- | -- | -- | Apr 17 | Apr 21 | Apr 29 | May 12 | May 04 | May 03 | May 12 | May 14 | May 11 |
Note: F'cast = Forecast; Austria and Australia use logarithmic regression; all other use linear regression.
The Modified Control Chart’ Analysis reveals the following:
- Despite that one-day surge today, France is still looking good on the control chart and other measures
- Russia, Canada, and Brazil, have bad out-of-control behavior. Belgium and USA are behaving as tough cookies
- The other countries in the control charts are behaving really well: they send a strong ray of hope. But, Spain gives a scare once in a while.
Table I and Student t-tests
Table I results are getting better, indicating that the number of daily cases is falling, which is what really matters. Of the countries studied, only France appeared to have worse results today compared to last Friday. That’s because France had another surge today since yesterday.
We are now tracking only seven countries that we find are a representative sample of world COVID. The confidence results from t-tests are given below. Canada and Brazil reveal head storms, which matches the modified control chart analysis above:
Confidence of last 6 days average daily cases being lower than the three highest peaks
| Apr 5 | Apr 6 | Apr 7 | Apr 8 | Apr 9 | Apr 10 | Apr 13 | Apr 15 | Apr 17 | Apr 20 | Apr 22 | Apr 24 | Apr 27 | |
| n1+n2=7 | n1+n2=7 | n1+n2=7 | n1+n2=8 | n1+n2=8 | n1+n2=8 | n1+n2=8 | n1+n2=8 | n1+n2=9 | n1+n2=9 | n1+n2=9 | n1+n2=9 | n1+n2=9 | |
| Spain: | 90% | 95% | 95% | 99.5% | 99.9% | 99.9% | 99.9% | 99.5% | 99.5% | 99% | 99.5% | 99% | 99.5% |
| Belgium: | -- | 90% | 95% | 95% | 99% | 90% | 80% | <80% | 80% | 80% | 99.5% | 99% | 99.5% |
| Israel: | -- | -- | -- | -- | 95% | 95% | 99.5% | 99.95% | 99.5% | 99.95% | 99.5% | 99.5% | 99.5% |
| Brazil: | -- | -- | -- | -- | -- | -- | 95% | <80% | <80% | 80% | 90% | 80% | <80% |
| Canada: | -- | -- | -- | -- | -- | -- | 95% | 99% | 80% | <80% | <80% | 70% | 80% |
| France: | -- | -- | -- | -- | -- | -- | 95% | 95% | 95% | 95% | 99.95% | 99.5% | 99.5% |
| USA: | -- | -- | -- | -- | -- | -- | 80% | 99.5% | 95% | 99% | 99% | 80% | 80% |
Notes: Conf = Confidence
Closure
The world might be getting used to staying at home, but they are also clamoring to be let loose. Countries and regions that opened their beaches saw a spurt of visitors; but those beaches are being monitored for social distance, which, we hope, will not cause untoward incidents.
| COVID-19 Cases (April 24) | 4/24/2020 |
| COVID-19 Control Charts (April 24) | |
| COVID-19 Regression (April 24) |
Cyprus again had daily cases today in the single digits. In Cyprus, the chance of dying from COVID now is less than dying from influenza, as in Hawaii. The projected lognormal regressed date for Cyprus when all cases will become zero now is signaled at May 24, which is a little better than two days ago. Cyprus has had less than or equal to 12 cases a day for 7 days in a row. This is fortunate and welcome news!
Australia is also in the single digits of daily cases; and Austria is coming down fast. They are obviously doing something right, which would be worth looking into.
The USA gave a shock to the world today, as did Brazil and Canada over the past two days. Conspiracy would be ripe here, but we’d rather refrain from that. Russia also scared everyone today. But, Turkey is doing better.
We were surprised that Belgium decided to open shops in early May because Belgium is among the hardest hit countries in Western Europe. But, local counties probably know a lot more than us, and everyone is eager to get back to their livelihoods.
Projected Dates Based on Regressing Peak values
On regressing the peak values, occurring periodically every 4-8 days, we find that the projected end dates are as follows:
| Projected Date | Wave Period | |
| Italy: | May 25 | 6 days |
| Spain: | June 15 | 7 days |
| Germany: | May 12 | 7 days |
| Switzerland: | May 03 | 6 days |
| France: | May 13 | 4 days |
| Cyprus: | May 24 | 7 days |
Each country has its characteristic wave period, the most common of which is 7 days. The charts for these are attached.
Regression Analysis and Modified Control Chart’ Analysis
We continued with logarithmic regression for the countries below. The forecast we get for when cases will become zero are given.
Forecast Date
| Apr 5 | Apr 6 | Apr 7 | Apr 8 | Apr 9 | Apr 10 | Apr 13 | Apr 15 | Apr 17 | Apr 20 | Apr 22 | Apr 24 | |
Australia: |
Apr 15 |
Apr 15 |
Apr 14 |
Apr 13 |
Apr 14 |
Apr 14 |
Apr 14 |
May 01 |
Apr 30 |
Apr 29 |
Apr 28 |
Apr 28 |
| Iran: | Apr 26 | Apr 25 | Apr 24 | Apr 24 | Apr 22 | Apr 24 | Apr 26 | Apr 28 | May 01 | May 03 | May 05 | @@ |
| Austria: | -- | -- | Apr 11 | Apr 12 | Apr 13 | Apr 14 | Apr 15 | Apr 26 | Apr 26 | Apr 26 | Apr 27 | Apr 27 |
| Cyprus: | -- | -- | -- | -- | -- | -- | -- | -- | -- | -- | May 29 | May 24 |
| Israel: | -- | -- | -- | -- | Apr 17 | Apr 21 | Apr 29 | May 12 | May 04 | May 03 | May 12 | May 14 |
Note: F'cast = Forecast; Austria and Australia use logarithmic regression; all other use linear regression.
The Modified Control Chart’ Analysis reveals the following:
- Canada, Brazil, and USA have bad out-of-control behavior
- Belgium and Spain can give scares
- Italy, Germany, Switzerland, Austria, Cyprus, and Australia are displaying very promising and good out-of-control behavior. All these countries have the highest performance of nine consecutive points on the southern side of the average!
Table I and Student t-tests
Table I results are still competitive to Apr 24 as compared to Apr 22, despite the recent surges and surprises worldwide in the past two days. The confidence results from t-tests are given below. Canada and Brazil reveal head storms, which matches the modified control chart analysis above:
Confidence of last 6 days average daily cases being lower than the three highest peaks
| Apr 5 | Apr 6 | Apr 7 | Apr 8 | Apr 9 | Apr 10 | Apr 13 | Apr 15 | Apr 17 | Apr 20 | Apr 22 | Apr 24 | |
| n1+n2=7 | n1+n2=7 | n1+n2=7 | n1+n2=8 | n1+n2=8 | n1+n2=8 | n1+n2=8 | n1+n2=8 | n1+n2=9 | n1+n2=9 | n1+n2=9 | n1+n2=9 | |
Australia: |
99% |
99.9% |
99.9% |
99.9% |
99.9% |
99.9% |
99.9% |
99.99% |
99.99% |
99.99% |
** |
** |
| Spain: | 90% | 95% | 95% | 99.5% | 99.9% | 99.9% | 99.9% | 99.5% | 99.5% | 99% | 99.5% | 99% |
| Switzerland: | 95% | 99% | 99% | 99.5% | 99.5% | 99.5% | 99.9% | 99.99% | 99.99% | 99.99% | ** | ** |
| Germany: | 80% | 95% | 95% | 99.5% | 99.5% | 99.5% | 99.5% | 99.99% | 99.99% | 99.99% | 99.99% | ** |
| Italy: | 99% | 99% | 99% | 99.5% | 99.9% | 99.9% | 99.9% | 99.5% | 99.99% | 99.99% | 99.99% | ** |
| Austria: | -- | 99% | 99% | 99.5% | 99.5% | 99.5% | 99.5% | 99.95% | 99.99% | 99.99% | ** | ** |
| Belgium: | -- | 90% | 95% | 95% | 99% | 90% | 80% | <80% | 80% | 80% | 99.5% | 99% |
| Israel: | -- | -- | -- | -- | 95% | 95% | 99.5% | 99.95% | 99.5% | 99.95% | 99.5% | 99.5% |
| Brazil: | -- | -- | -- | -- | -- | -- | 95% | <80% | <80% | 80% | 90% | 80% |
| Canada: | -- | -- | -- | -- | -- | -- | 95% | 99% | 80% | <80% | <80% | 70% |
| Iran: | -- | -- | -- | -- | -- | -- | 99.9% | 99.99% | 99.99% | 99.99% | @@ | @@ |
| France: | -- | -- | -- | -- | -- | -- | 95% | 95% | 95% | 95% | 99.95% | 99.5% |
| USA: | -- | -- | -- | -- | -- | -- | 80% | 99.5% | 95% | 99% | 99% | 80% |
Note:
Conf = Confidence
** = analysis discontinued because difference is established beyond doubt
@@ = analysis discontinued because of doubt in data
Closure
Every generation sees its load of troubles. Three generations ago, we had WWII; two generations ago the severe oil crisis; one generation ago (nearly), the 9-11 terror crisis; and now COVID (assume each generation is approx. 25 years). A different attitude to life is necessary, one that is more inclusive and compassionate. But, we know there are those who won’t waste a crisis for advantage. One simply has to spread the message of peace and resolution.
Please pardon our limited analysis: we simply can’t cover the whole world. Hence, that is why we’ve selected the most-affected countries and other countries of special interest that give us special insights into this virus.
| COVID-19 Cases (April 22) | 4/22/2020 |
| COVID-19 Control Charts (April 22) | |
| COVID-19 Linear Regression (April 22) |
Cyprus is seeing solid declines, with an average of 8 cases/day over the past five days. Hawaii had an average of 4.5 cases/day these past four days. Our regression of peak values shows cases in Cyprus becoming zero by May 24. Log regression of Cyprus cases gives a date of May 29, within range of the other regression. Our projected dates for Italy, Spain, Germany, and Switzerland have not changed since yesterday.
Australia went even further in its decline of cases today, having only 4 cases. We hope it can quickly become the first continent to have no COVID cases. All major countries in Western Europe continued their decline.
The USA and world continue to drop, as well, albeit at slower paces Thankfully, Russia hasn’t exceeded its peak since the past three days, Turkey for the past 11 days, Brazil for 7 days.
Table I and Student t-tests
The average of the past five days are now definitely off their peak value. The confidence results from t-tests are given below:
| Conf | Conf | Conf | Conf | Conf | Conf | Conf | Conf | Conf | Conf | Conf | |
| Apr 5 | Apr 6 | Apr 7 | Apr 8 | Apr 9 | Apr 10 | Apr 13 | Apr 15 | Apr 17 | Apr 20 | Apr 22 | |
| n1+n2=7 | n1+n2=7 | n1+n2=7 | n1+n2=8 | n1+n2=8 | n1+n2=8 | n1+n2=8 | n1+n2=8 | n1+n2=9 | n1+n2=9 | n1+n2=9 | |
Australia: |
99% |
99.9% |
99.9% |
99.9% |
99.9% |
99.9% |
99.9% |
99.99% |
99.99% |
99.99% |
** |
| Spain: | 90% | 95% | 95% | 99.5% | 99.9% | 99.9% | 99.9% | 99.5% | 99.5% | 99% | 99.5% |
| Switzerland: | 95% | 99% | 99% | 99.5% | 99.5% | 99.5% | 99.9% | 99.99% | 99.99% | 99.99% | ** |
| Germany: | 80% | 95% | 95% | 99.5% | 99.5% | 99.5% | 99.5% | 99.99% | 99.99% | 99.99% | 99.99% |
| Italy: | 99% | 99% | 99% | 99.5% | 99.9% | 99.9% | 99.9% | 99.5% | 99.99% | 99.99% | 99.99% |
| Austria: | -- | 99% | 99% | 99.5% | 99.5% | 99.5% | 99.5% | 99.95% | 99.99% | 99.99% | ** |
| Belgium: | -- | 90% | 95% | 95% | 99% | 90% | 80% | <80% | 80% | 80% | 99.5% |
| Israel: | -- | -- | -- | -- | 95% | 95% | 99.5% | 99.95% | 99.5% | 99.95% | 99.5% |
| Brazil: | -- | -- | -- | -- | -- | -- | 95% | <80% | <80% | 80% | 90% |
| Canada: | -- | -- | -- | -- | -- | -- | 95% | 99% | 80% | <80% | <80% |
| Iran: | -- | -- | -- | -- | -- | -- | 99.9% | 99.99% | 99.99% | 99.99% | ** |
| France: | -- | -- | -- | -- | -- | -- | 95% | 95% | 95% | 95% | 99.95% |
| USA: | -- | -- | -- | -- | -- | -- | 80% | 99.5% | 95% | 99% | 99% |
Note:
Belgium and Brazil are emerging; Canada is struggling, confirming our control chart analysis of yesterday. We discontinued the t-test analysis for Australia, Austria, and Switzerland because there is no doubt for them on the matter. We are discontinuing Iran because we don’t want to waste our time on possibly analyzing unreliable data.
Regression Analysis and Modified Control Chart’ Analysis
We continued with logarithmic regression for the countries below. The forecast we get for when cases will become zero are given.
| F'cast | F'cast | F'cast | F'cast | F'cast | F'cast | F'cast | F'cast | F'cast | F'cast | F'cast | |
| Apr 5 | Apr 6 | Apr 7 | Apr 8 | Apr 9 | Apr 10 | Apr 13 | Apr 15 | Apr 17 | Apr 20 | Apr 22 | |
Australia: |
Apr 15 |
Apr 15 |
Apr 14 |
Apr 13 |
Apr 14 |
Apr 14 |
Apr 14 |
May 01 |
Apr 30 |
Apr 29 |
Apr 28 |
| Iran: | Apr 26 | Apr 25 | Apr 24 | Apr 24 | Apr 22 | Apr 24 | Apr 26 | Apr 28 | May 01 | May 03 | May 05 |
| Austria: | -- | -- | Apr 11 | Apr 12 | Apr 13 | Apr 14 | Apr 15 | Apr 26 | Apr 26 | Apr 26 | Apr 27 |
| Israel: | -- | -- | -- | -- | Apr 17 | Apr 21 | Apr 29 | May 12 | May 04 | May 03 | May 12 |
Note: F'cast = Forecast; Austria and Australia use logarithmic regression; all other use linear regression.
The Modified Control Chart’ Analysis reveals the following:
- Canada is out-of-control to the wrong side
- Brazil is borderline (struggling)
- Cyprus, Australia, Austria may be coming close to the end of the crisis.
- All countries in Western Europe are doing relatively fine in reducing the incidence of daily cases.
Closure
Travel is expected to start slowly; demand will be slow at first, but that is just as well for social distancing; seats may be staggered with a space between, with everyone having to wear masks. We can also imagine that countries could ask for a COVID-19 clearance certificate before entering their country.
Our heart goes out to the poor people in India. Despite all the poverty, India enforces the lockdown with police strictness, but what other option does the country have. People are still walking back to their villages after public transport was all closed.
| COVID-19 Cases (April 20) | 4/20/2020 |
| COVID-19 Control Charts (April 20) | |
| COVID-19 Peak Regression (April 20) |
Today, we did something different. Instead of regressing the entire distribution from peak till today, we regressed only the peak values. That is because COVID declines in waves. Hence, a regression of the peak values should yield a more realistic picture of things to come. We did this only for Italy, Spain, Germany, and Switzerland. Interestingly, they all have average periods close to 7 days. This was quite a discovery. Now, we can find some method to the madness.
The projected dates for emerging from the crisis for the above four countries are now as below. Their day-over-day declining rates are given alongside:
| Projected End |
Declining Rate |
|
| Italy: | May 24 | 104 cases/day |
| Spain: | June 15 | 104 cases/day |
| Germany: | May 12 | 161 cases/day |
| Switzerland: | May 03 | 34 cases/day |
We now feel that these are more realistic than anything we’ve done so far in previous days. This has been made possible simply by using a better concept for
regression. We should have got this idea earlier, but even Henry Ford could not make the type of cars we make in 2020.
But, these confirm our long view,
mentioned in earlier days, that we should consider ourselves under some bondage till May 31. The regression for Spain confirmed our fears that Spain is declining
slowly. Switzerland is on the somewhat fast-track to recovery; Germany is looking set.
Turkey could be past its peak; Brazil is giving hope; Russia should
not celebrate a day’s decline, but it sure gives some sense of relief; India could really be on the downward trend, at last; Australia and Austria continue to be our
poster boys; Iran’s numbers are unreliable, smacking of artificiality; But Egypt is still struggling at peak values.
Singapore is a surprise because one had
thought earlier that Singapore had got COVID on a leash. But, it appears that Singapore’s immigrant workers, who are packed like sardines -- living four to a small
quarter -- have exploded with COVID from around only 386 cases a week ago to nearly 1426 cases today. Goes to show that there is still mistreatment of workers in
first world countries.
The worldwide daily cases profile still holds steady, despite all the good news from the seriously-affected West European countries.
The 5-day moving average of daily cases for the world looks like a horizontal line.
In the end what God wants will happen, without a doubt, but humans are making a lot of good effort. The troublesome part is when in certain areas of lockdown, people defy the curfew; when mayors ask people to wear masks, the people flout the orders. This has given birth to a new breed of people called COV-Id-iots!
COVID v. Influenza
We know that, by and large, that 10% of any population catches the influenza and flu viruses in any season (90-days). Hence, in a population of 10 million, one million will catch the flu or influenza virus. Of these 0.1% will die. So, out of one million, 1,000 will die. Over a 90-day period, this amounts to 11.1 people dying daily.
But, COVID has a 10% death rate, as clearly evidenced already in Italy, Spain, France, UK, Belgium, and Netherlands. For the COVID death rate to be the same as that of influenza and flu – 11.1 cases a day – a country of population 10 million will have 111 COVID cases a day.
There is some rationality in assessing that if the COVID death rate falls to the level of flu and influenza, without a likely chance of resurgence, that humanity could possibly live with it for the next year or two till we somehow push COVID into the ground.
People Want to Return to Work
All around the world, people are impatient and wish to get back to work. The various jurisdictions have different priorities for phased re-opening, depending on the top businesses in the area, local sentiments, effort of lobbyists, etc. Not always does the reopening schedule match the recommendations of science. For instance, the State of Georgia in USA wants to reopen tattoo parlors and bars, as if that was the most important thing in life, but I am sure the governor there has his reasons; Florida wants to reopen wrestling. Different countries in Europe want to reopen different establishments first: some want to reopen shops and stores; some want to open elementary schools; others wish to restart their factories; others want to reopen sports centers and gymnasiums. Reopening will happen in due course, but our recommendation is that the cure should be cautiously applied. Convalescence takes time. Those who do not convalesce gradually, tend to face another shock later.
Hawaii and Cyprus
Hawaii (pop. 1.4 million,4 cases yesterday)) and Cyprus (pop. 1.2 million, 5 cases yesterday) both have fewer than 14 and 12 daily cases, respectively, which makes their death incidence rate from COVID equal less than half that from the common flu and influenza. This is livable.
Hawaii has today the lowest per capita cases in USA. This may be due to the timely lockdown measures, closure of schools, curfew, and executive order to wear masks. But, Hawaii is definitely taking it easy. The low per capita cases have come at a price because Hawaii’s unemployment rate is now the highest in the nation (37%). This contrasts with the second-lowest unemployment rate in USA that Hawaii had in March 2020, 2.6%, after North Dakota, 2.2%. So, everyone wants to get back to work!
Table I and Student t-tests
We continue our analysis of the highest three-day ratio to peak value, and the Student t-tests. The average of the past five days are now significantly coming off the peak value. The Student t-test reveals the same thing.
The confidence results are given below:
| Conf | Conf | Conf | Conf | Conf | Conf | Conf | Conf | Conf | Conf | |
| Apr 5 | Apr 6 | Apr 7 | Apr 8 | Apr 9 | Apr 10 | Apr 13 | Apr 15 | Apr 17 | Apr 20 | |
| n1+n2=7 | n1+n2=7 | n1+n2=7 | n1+n2=8 | n1+n2=8 | n1+n2=8 | n1+n2=8 | n1+n2=8 | n1+n2=9 | n1+n2=9 | |
Australia: |
99% |
99.9% |
99.9% |
99.9% |
99.9% |
99.9% |
99.9% |
99.99% |
99.99% |
99.99% |
| Spain: | 90% | 95% | 95% | 99.5% | 99.9% | 99.9% | 99.9% | 99.5% | 99.5% | 99% |
| Switzerland: | 95% | 99% | 99% | 99.5% | 99.5% | 99.5% | 99.9% | 99.99% | 99.99% | 99.99% |
| Germany: | 80% | 95% | 95% | 99.5% | 99.5% | 99.5% | 99.5% | 99.99% | 99.99% | 99.99% |
| Italy: | 99% | 99% | 99% | 99.5% | 99.9% | 99.9% | 99.9% | 99.5% | 99.99% | 99.99% |
| Austria: | -- | 99% | 99% | 99.5% | 99.5% | 99.5% | 99.5% | 99.95% | 99.99% | 99.99% |
| Belgium: | -- | 90% | 95% | 95% | 99% | 90% | 80% | <80% | 80% | 80% |
| Israel: | -- | -- | -- | -- | 95% | 95% | 99.5% | 99.95% | 99.5% | 99.95% |
| Brazil: | -- | -- | -- | -- | -- | -- | 95% | <80% | <80% | 80% |
| Canada: | -- | -- | -- | -- | -- | -- | 95% | 99% | 80% | <80% |
| Iran: | -- | -- | -- | -- | -- | -- | 99.9% | 99.99% | 99.99% | 99.99% |
| France: | -- | -- | -- | -- | -- | -- | 95% | 95% | 95% | 95% |
| USA: | -- | -- | -- | -- | -- | -- | 80% | 99.5% | 95% | 99% |
| Note: Conf = Confidence |
You can see how Brazil, Canada, and Belgium are suffering. Believe it or not, but the USA is markedly recovering. (For Wednesday, we will drop off Australia, Austria, and Switzerland from this analysis because they might have recovered enough for us to pause this t-test analysis; we’ll drop off Iran, as well, because we fail to rely convincingly on their numbers).
Regression Analysis and Modified Control Chart’ Analysis
We continued with logarithmic regression for countries that are reaching below 111 COVID cases a day per 10 million population – Australia and Austria. Not only that, but the profile has to definitely “look” logarithmic. Israel has just about met our cut-off of less than 11 cases per 10 million population, but its profile is far from logarithmic.
| F'cast | F'cast | F'cast | F'cast | F'cast | F'cast | F'cast | F'cast | F'cast | F'cast | |
| Apr 5 | Apr 6 | Apr 7 | Apr 8 | Apr 9 | Apr 10 | Apr 13 | Apr 15 | Apr 17 | Apr 20 | |
Australia: |
Apr 15 |
Apr 15 |
Apr 14 |
Apr 13 |
Apr 14 |
Apr 14 |
Apr 14 |
May 01 |
Apr 30 |
Apr 29 |
| Iran: | Apr 26 | Apr 25 | Apr 24 | Apr 24 | Apr 22 | Apr 24 | Apr 26 | Apr 28 | May 01 | May 03 |
| Austria: | -- | -- | Apr 11 | Apr 12 | Apr 13 | Apr 14 | Apr 15 | Apr 26 | Apr 26 | Apr 26 |
| Israel: | -- | -- | -- | -- | Apr 17 | Apr 21 | Apr 29 | May 12 | May 04 | May 03 |
Note: F'cast = Forecast; Austria and Australia use logarithmic regression; all other use linear regression.
The Modified Control Chart’ Analysis reveals the following:
- France and USA could be getting the break they need.
- Italy has dropped to one-third its peak value; Spain to one-fifth.
- Germany has declined effectively and significantly.
- Iran’s numbers look fudged!
- Brazil and Canada are in tough waters.
- Austria and Australia have broken clear; Switzerland is close on the heels.
Closure
As people begin to go back to their businesses and daily life, we are optimistic that travel will restart in due course. But, open up gradually; don’t rush it; make phased withdrawals.
| Daily New Case and Regression Analysis (April 17) | 4/17/2020 |
| 'Modified' Control Chart Analysis (April 17) |
The decline of COVID in the world is obvious, but the duration it will take to decline is the new issue today. One has to keep the long view – till May 31 – before
rational normality may return. Despite all the declines in Spain and Germany and Italy, the daily number of COVID cases still cause deaths many times higher than
influenza. Only in Australia have we got lower COVID incidences than cause deaths due to influenza; Austria is close, which is why we used logarithmic regression for
those two countries. The other countries in our sample – Spain, Germany, Italy, Switzerland, Iran, and Israel are still distant from us applying logarithmic
regression.
We would study more countries – and increase our sample size – and perhaps do additional statistical analysis -- but our resources and volunteers
are simply not large enough.
While there are many deadly viruses out there, COVID is easy to catch if social distance and cleanliness are ignored. The world
knows of precautions to take against malaria and dengue or HIV, for instance, but the precautions for COVID take us back to many thousand years when cleanliness became
a fundamental part of religious life. We note that the ancient Jain Tirthankars and even present-day Jain monks
wear a mask to cover their mouth as a matter
of daily life.
We continue to worry about Brazil and Russia, but we realize that they started their COVID cases a week to two weeks after the first cases in Western Europe, so we must not become impatient too soon. Quite correctly, Russia postponed its mighty military parade.
Turkey could be coming off its highs, but Canada had a rough two days, seeing new highs in daily cases. But, this disease is nothing the world has ever seen, and it’s caused a real disruption to life in most of the world, and in 44 out of 50 states in USA. However, some states are doing very well handling this virus, such as North and South Dakota, which have no lockdown. The 5-day moving average shows that the UK is leveling off.
Hawaii and Cyprus both exhibit their “third” decline wave. Each decline wave is about 4-8 days, as also exhibited by Italy and Germany very clearly. Hawaii shows a good fit to a normal distribution, so we hope it stays that way.
But, the 5-day moving average for the world shows that daily cases are steady at 80,000 per day! This translates to a death rate of 576,000 per 3-month season (roughly), which is a little less than the death rate of 700,000 per 3-month season (roughly) by influenza. So, the world, as a whole, is not in much of a crisis, statistically speaking. Presently, the total deaths in the world owing to COVID, give or take a few, is 154,266.
Though we regret if there was a leak from the BSL-4 lab at Wuhan, humanity will, no doubt, survive. We always suggest that it is a good thing to say your prayers every day, and every hour, and even more frequently, COVID or no COVID.
Table I and Student t-tests
Table I in the power point attachment shows that USA has the highest three-day ratio to peak value. The other countries in our sample are coming off their highs.
This is corroborated by Student t-tests for the confidence of the decline. There is absolutely no doubt that the decline is very significantly off the peak values. We increased the sample size today, so the stats make it easier to pass the t-alpha values because the results become more reliable as sample size increases.
But, the secret of the decline is in the “steady” decline. Ever seen a kite fall from the sky? Does it fall down straight? No, it glides slowly down in waves till it comes to rest some distance away. That is the nature of the COVID decline, as well. We will measure that decline, as soon as we get additional resources.
The confidence results are given below:
| Conf | Conf | Conf | Conf | Conf | Conf | Conf | Conf | Conf | |
| Apr 5 | Apr 6 | Apr 7 | Apr 8 | Apr 9 | Apr 10 | Apr 13 | Apr 15 | Apr 17 | |
| n1+n2=7 | n1+n2=7 | n1+n2=7 | n1+n2=8 | n1+n2=8 | n1+n2=8 | n1+n2=8 | n1+n2=8 | n1+n2=9 | |
Australia: |
99% |
99.9% |
99.9% |
99.9% |
99.9% |
99.9% |
99.9% |
99.99% |
99.99% |
| Spain: | 90% | 95% | 95% | 99.5% | 99.9% | 99.9% | 99.9% | 99.5% | 99.5% |
| Switzerland: | 95% | 99% | 99% | 99.5% | 99.5% | 99.5% | 99.9% | 99.99% | 99.99% |
| Germany: | 80% | 95% | 95% | 99.5% | 99.5% | 99.5% | 99.5% | 99.99% | 99.99% |
| Italy: | 99% | 99% | 99% | 99.5% | 99.9% | 99.9% | 99.9% | 99.5% | 99.99% |
| Austria: | -- | 99% | 99% | 99.5% | 99.5% | 99.5% | 99.5% | 99.95% | 99.99% |
| Belgium: | -- | 90% | 95% | 95% | 99% | 90% | 80% | <80% | 80% |
| Israel: | -- | -- | -- | -- | 95% | 95% | 99.5% | 99.95% | 99.5% |
| Brazil: | -- | -- | -- | -- | -- | -- | 95% | <80% | <80% |
| Canada: | -- | -- | -- | -- | -- | -- | 95% | 99% | 80% |
| Iran: | -- | -- | -- | -- | -- | -- | 99.9% | 99.99% | 99.99% |
| France: | -- | -- | -- | -- | -- | -- | 95% | 95% | 95% |
| USA: | -- | -- | -- | -- | -- | -- | 80% | 99.5% | 95% |
| Note: Conf = Confidence |
Canada and Brazil took a hit today because of a recent surge in cases. While we pray for their turnaround, we are very optimistic of the rising success of all countries that have reached 99.99% confidence in the difference from their peak.
Regression Analysis
We continued with logarithmic regression for countries that are reaching below 111 COVID cases a day per 10 million population. Australia is already there, while Austria is very close. This is necessary to do when cases decline because the decline has a long tail to the right. Linear regression will not work in this case. The regressions reveal the following for daily cases reaching zero or a bare minimum:
| F'cast | F'cast | F'cast | F'cast | F'cast | F'cast | F'cast | F'cast | F'cast | |
| Apr 5 | Apr 6 | Apr 7 | Apr 8 | Apr 9 | Apr 10 | Apr 13 | Apr 15 | Apr 17 | |
Australia: |
Apr 15 |
Apr 15 |
Apr 14 |
Apr 13 |
Apr 14 |
Apr 14 |
Apr 14 |
May 01 |
April 30 |
| Iran: | Apr 26 | Apr 25 | Apr 24 | Apr 24 | Apr 22 | Apr 24 | Apr 26 | Apr 28 | May 01 |
| Spain: | May 01 | May 06 | May 03 | May 06 | May 04 | May 04 | Apr 30 | May 05 | May 10 |
| Switzerland: | May 09 | May 03 | May 01 | May 09 | May 10 | May 07 | Apr 29 | Apr 28 | Apr 28 |
| Germany: | May 12 | Apr 28 | Apr 28 | May 08 | May 14 | May 11 | Apr 29 | Apr 28 | May 01 |
| Italy: | May 18 | May 12 | May 06 | May 07 | May 10 | May 12 | May 19 | May 15 | May 19 |
| Austria: | -- | -- | Apr 11 | Apr 12 | Apr 13 | Apr 14 | Apr 15 | Apr 26 | Apr 26 |
| Israel: | -- | -- | -- | -- | April 17 | April 21 | April 29 | May 12 | May 04 |
| Note: F'cast = Forecast |
Modified Control Chart’ Analysis
Brazil and Canada displayed an out-of-control trend to the bad side. This was born out in their t-test results. So, we see that this modified control chart analysis and the t-tests corroborate each other. Our calculations are matching up!
Closure
Hold fast till mid-May! Keep the belt tightened till May 31. It is a hard and slow grind to the finish!
We are watching all this closely, as we wish to hold our EURO MED SEC 3 conference in early August. Some other conferences have not canceled their August engagements as yet, such as the Association of Pacific Ports. We truly hope the world recovers quickly, which is within its ability.
We hope the Fall period does not see a second wave of the virus, as happened during the Spanish influenza of 1918.
PowerPoint |
4/15/2020 |
The decline of COVID in the world is obvious, despite daily volatility, as experienced by Spain today. Such surges
are symptomatic of the declining “waves” we observe. The new crests during the decline are invariably lower than
previous highs. So, the wave abates gradually.
It is on everybody’s mind – especially of the decision
makers in countries – for when to reopen their country. Making this determination is not easy, except that we should
take a conservative approach. Spain already opened some of its factories and construction sites; Italy wants to
start small by opening bookshops and children’s clothing stores; Macron is holding firm to the May 15 lockdown date
in France; Denmark is preparing to reopen schools for younger children; and Austria wants to reopen hardware and home improvement stores. These show how different cultures hold different values important. President Trump is now talking of an opening on May 01, but USA still has the maximum cases and deaths in the world. However, a President has to keep hopes alive. And, countries are between a rock and a hard place. The issues at hand are how much to open without endangering community health and stability. The cure should not become worse than the disease: the economy is a serious concern. As in all engineering, optimization is of paramount importance.
Russia is of serious concern as the growth rate averaged a high 19.5% in the last four days; Brazil surged to new highs; Turkey and USA are struggling. India could be at the cusp because it could either explode or decline. There are some dark spots in the world, much as there are bright spots. A lot of the outcome depends on the capabilities of the health systems in the countries, the seriousness with which the politicians take the issue, the quality of advice, and the pressure of local lobbies and businesses.
The worldwide daily cases remain under check – and are also declining in waves. It is a hard and slow grind to the finish!
Table I and Student t-tests
Table I in the power point attachment show that all countries studied are well off their peaks. The Student t-tests corroborate what Table I shows, albeit with greater statistical rigor. The confidence rose dramatically for USA. From today, we started checking for 99.95% and 99.99% confidences, so we find that Australia, Germany, Switzerland and Iran are really cutting it.
The confidence results are given below:
| Conf | Conf | Conf | Conf | Conf | Conf | Conf | Conf | |
| Apr 5 | Apr 6 | Apr 7 | Apr 8 | Apr 9 | Apr 10 | Apr 13 | Apr 15 | |
| n1+n2=7 | n1+n2=7 | n1+n2=7 | n1+n2=8 | n1+n2=8 | n1+n2=8 | n1+n2=8 | n1+n2=8 | |
Australia: |
99% |
99.9% |
99.9% |
99.9% |
99.9% |
99.9% |
99.9% |
99.99% |
| Spain: | 90% | 95% | 95% | 99.5% | 99.9% | 99.9% | 99.9% | 99.5% |
| Switzerland: | 95% | 99% | 99% | 99.5% | 99.5% | 99.5% | 99.9% | 99.99% |
| Germany: | 80% | 95% | 95% | 99.5% | 99.5% | 99.5% | 99.5% | 99.99% |
| Italy: | 99% | 99% | 99% | 99.5% | 99.9% | 99.9% | 99.9% | 99.5% |
| Austria: | -- | 99% | 99% | 99.5% | 99.5% | 99.5% | 99.5% | 99.95% |
| Belgium: | -- | 90% | 95% | 95% | 99% | 90% | 80% | <80% |
| Israel: | -- | -- | -- | -- | 95% | 95% | 99.5% | 99.95% |
| Brazil: | -- | -- | -- | -- | -- | -- | 95% | <80% |
| Canada: | -- | -- | -- | -- | -- | -- | 95% | 99% |
| Iran: | -- | -- | -- | -- | -- | -- | 99.9% | 99.99% |
| France: | -- | -- | -- | -- | -- | -- | 95% | 95% |
| USA: | -- | -- | -- | -- | -- | -- | 80% | 99.5% |
| Note: Conf = Confidence |
Belgium and Brazil took a hit today because of a recent surge in cases, especially Brazil. However, declines come in “waves”, so we have to accept relative increases in daily cases every few days.
Regression Analysis
We started today to adopt logarithmic regression for countries that are reaching below 111 cases a day – Australia and Austria. This is necessary to do when cases decline because the decline has a long tail to the right. Linear regression will not work in this case. The regression reveals the following for daily cases reaching zero or a bare minimum:
| F'cast | F'cast | F'cast | F'cast | F'cast | F'cast | F'cast | F'cast | |
| Apr 5 | Apr 6 | Apr 7 | Apr 8 | Apr 9 | Apr 10 | Apr 13 | Apr 15 | |
Australia: |
Apr 15 |
Apr 15 |
Apr 14 |
Apr 13 |
Apr 14 |
Apr 14 |
Apr 14 |
May 01 |
| Iran: | Apr 26 | Apr 25 | Apr 24 | Apr 24 | Apr 22 | Apr 24 | Apr 26 | Apr 28 |
| Spain: | May 01 | May 06 | May 03 | May 06 | May 04 | May 04 | Apr 30 | May 05 |
| Switzerland: | May 09 | May 03 | May 01 | May 09 | May 10 | May 07 | Apr 29 | Apr 28 |
| Germany: | May 12 | Apr 28 | Apr 28 | May 08 | May 14 | May 11 | Apr 29 | Apr 28 |
| Italy: | May 18 | May 12 | May 06 | May 07 | May 10 | May 12 | May 19 | May 15 |
| Austria: | -- | -- | Apr 11 | Apr 12 | Apr 13 | Apr 14 | Apr 15 | Apr 26 |
| Israel: | -- | -- | -- | -- | April 17 | April 21 | April 29 | May 12 |
| Note: F'cast = Forecast |
Whereas, the incidence of daily cases in Australia is already low, logarithmic regression shows that we can expect to see the virus defeated by May 1; For Austria – Apr 26. These are more realistic and reliable numbers now than the former linear regression. We will switch to logarithmic regression any time daily cases go to less than 111 cases. In fact, we could even consider 111 cases per 10 million country population. But, the world should not let its guard down till May 15, as our regressions show, and then keep the belt tightened till May 31. This virus is like nothing the present generations have seen.
Modified Control Chart’ Analysis
The ‘modified’ control charts are still on track to show that all the countries studied are doing well. Essentially, we aren’t relapsing, though we have to be careful of a second wave in the Fall time period.
Closure
Hold fast till mid-May! Keep the belt tightened till May 31. It is a hard and slow grind to the finish!
We hope the Fall period does not see a second wave of the virus, as happened during the Spanish influenza of 1918.
PowerPoint |
4/13/2020 |
We excitedly observe the decline in daily cases in Western Europe and USA/Canada – the most heavily affected regions
in the world. We are happy to see that Australia may have reached its last taper to end soon. Even Brazil declined – the largest country in South America -- which is welcome news.
While the incidence rates are declining, it is doing so in waves – like the temperatures changing while warming or cooling on the planet. Perhaps this is the natural way in which the virus abates.
In South Korea, the number of cases causing death is fast approaching the death rate by influenza. We believe the world will want to restart its economy once that incidence rate is reached.
However, we welcome the news by French President Macron to extend the shut downs till mid-May. He might as well read our reports, because in our report of April 10 we asked everyone to sit tight till May 15!
India has also extended its lockdown by three weeks to May 3, but that could be extended once again if the cases don’t subside markedly. It is worthwhile taking the lockdowns seriously. Doing so – and not shaking hands anymore – will also curtail the spread of influenza and other flu viruses – a welcome side effect. It is meaningful that the Indians figured out from the dawn of time that greeting with folded palms was a better way than shaking hands, hugging, and kissing!
Of the top 15 countries – only Turkey (9th place) and Russia (15th place) continued to defy abatement. This is a matter of concern because those are relatively large countries by way of population.
Tables 1b and 2; Student t-tests
Tables 1b and 2 in the power point attachment show that all countries studied are well off their peaks. The growth rate has also been declining, in general, in the last three days. The Student t-tests corroborate what Table 2 shows, albeit with greater statistical rigor. The confidence by which we can predict that the daily cases of the last five days are significantly lower than the three highest peaks has been getting higher and higher. This is incontrovertible evidence that the cases are declining. But, that doesn’t mean we let down our guard yet.
The confidence holds for most countries that the number of daily cases of the five most-recent days is significantly off their three highest peaks. The confidence results are given below:
| Conf | Conf | Conf | Conf | Conf | Conf | Conf | |
| Apr 5 | Apr 6 | Apr 7 | Apr 8 | Apr 9 | Apr 10 | Apr 13 | |
| n1+n2=7 | n1+n2=7 | n1+n2=7 | n1+n2=8 | n1+n2=8 | n1+n2=8 | n1+n2=8 | |
Australia: |
99% |
99.9% |
99.9% |
99.9% |
99.9% |
99.9% |
99.9% |
| Spain: | 90% | 95% | 95% | 99.5% | 99.9% | 99.9% | 99.9% |
| Switzerland: | 95% | 99% | 99% | 99.5% | 99.5% | 99.5% | 99.9% |
| Germany: | 80% | 95% | 95% | 99.5% | 99.5% | 99.5% | 99.5% |
| Italy: | 99% | 99% | 99% | 99.5% | 99.9% | 99.9% | 99.9% |
| Austria: | -- | 99% | 99% | 99.5% | 99.5% | 99.5% | 99.5% |
| Belgium: | -- | 90% | 95% | 95% | 99% | 90% | 80% |
| Israel: | -- | -- | -- | -- | 95% | 95% | 99.5% |
| Brazil: | -- | -- | -- | -- | -- | -- | 95% |
| Canada: | -- | -- | -- | -- | -- | -- | 95% |
| Iran: | -- | -- | -- | -- | -- | -- | 99.9% |
| France: | -- | -- | -- | -- | -- | -- | 95% |
| USA: | -- | -- | -- | -- | -- | -- | 80% |
| Note: Conf = Confidence |
The confidence rose for every country except Belgium, which had a rough patch last five days; three of the last five days are very high numbers. The results for USA show that the decline is reaching some solid footing, though we must be on the watch.
The only question is when this all will end. Well, we are brave enough to hazard a guess with the regression below. However, we still stand by our projections of April 9, where we believe that +1 week and +2 weeks are generally more representative of the wavy decline we are seeing.
Regression Analysis
Linear Regression reveals the following for daily cases reaching zero or a bare minimum:
| F'cast | F'cast | F'cast | F'cast | F'cast | F'cast | F'cast | |
| Apr 5 | Apr 6 | Apr 7 | Apr 8 | Apr 9 | Apr 10 | Apr 13 | |
Australia: |
Apr 15 |
Apr 15 |
Apr 14 |
Apr 13 |
Apr 14 |
Apr 14 |
Apr 14 |
| Iran: | Apr 26 | Apr 25 | Apr 24 | Apr 24 | Apr 22 | Apr 24 | Apr 26 |
| Spain: | May 01 | May 06 | May 03 | May 06 | May 04 | May 04 | Apr 30 |
| Switzerland: | May 09 | May 03 | May 01 | May 09 | May 10 | May 07 | Apr 29 |
| Germany: | May 12 | Apr 28 | Apr 28 | May 08 | May 14 | May 11 | Apr 29 |
| Italy: | May 18 | May 12 | May 06 | May 07 | May 10 | May 12 | May 19 |
| Austria: | -- | -- | Apr 11 | Apr 12 | Apr 13 | Apr 14 | Apr 15 |
| Israel: | -- | -- | -- | -- | April 17 | April 21 | April 29 |
| Note: F'cast = Forecast |
Australia gives us the maximum hope: the cases are down so much that it appears Australia will be down to below 10 any day, now. In fact an incidence of 10 daily cases gives the same deaths per day as 1000 cases of influenza, which is also prevalent in this season. In fact, a country with a population of 10 million people can be expected to have a statistical incidence rate of 1 million cases of influenza per season of three months. Of these, 1,000 would die, at the death rate of 0.1%. To equal 1,000 influenza deaths over a season, the country would need to have 10,000 COVID-19 cases in a season. Over a season of 90 days, this would mean 111 new COVID cases a day. South Korea and Australia are already way below that number. Austria also gives an optimistic regression. But, in the event, our projections of Apr 9 that end-April will see us out of the woods for Austria and Australia is probably more representative of the events.
The linear regression works well even if the decline is in “waves.”
Modified Control Chart’ Analysis
The ‘modified’ control charts are still on track to show that all the countries studied are doing better. Israel gives surprises, while USA and France appear to just about start their decline. The control charts corroborate the student t-tests that show the countries really have declined. The control charts also reveal that the decline is in waves. For most countries, the decline may be longer than the rise.
Closure
Hold tight to the trenches till mid-May!
It is possible that COVID-19 will retreat as fast as it came. Statistical trends show that the world could proclaim itself in the decline after April 15. It is already the tenth day in a row that worldwide cases have declined from the peak. But, we will have to continue with our disciplined approach of precautions.
| Notice: The COVID-19 report on this page will henceforth only be published on M W F. Best wishes and stay safe. | 4/12/2020 |
PowerPoint |
4/10/2020 |
The large countries in mainland Europe were contained, exemplified by the countries we are tracking. Wherever you see, the decline is coming in waves – a decline, but then a rise – followed by a bigger decline and another rise – but trending downward all the while. Spain, Italy, Germany, and France display this pattern at medium frequencies; Switzerland at high frequency; while Austria is somewhat calmer. Australia and Israel also display this sinusoidal variation at varying frequencies. So, this is a pattern of how the virus is declining everywhere. We look positively on the downward trend of Australia. South Korea is further tapering off from its earlier taper, which is welcome news.
The bad news about USA is that its daily cases are still flirting with its highs; the good news, though, is that the daily cases aren’t breaking upwards. USA is central in this battle owing to its large population and large economy.
But, UK, Portugal, Netherlands, and Ireland rose with a vengeance. These FOUR countries are all on the western part of Western Europe, so we don't know what’s the matter there: perhaps, there is a regional factor that's causing this. Russia, Turkey, and India rose higher to new peaks. Not nice at all! We continue to watch with bated breath for some good news from these countries.
The world is off its peak for seven days in a row, but we still watch with trepidation because the daily cases are pretty close to the former peak.
What happens in Canada is likely going to be a function of USA. For USA, the projected cumulative profile looks as follows if we mirror the daily cases from start to peak and today all the way to decline. We are actually relieved that the Federal Government and State Governments are taking this pandemic seriously. Thus, we really are optimistic of the outcome despite all the depressing news. However, we always wish our politicians and bureaucrats could be better than they are, all over the world.
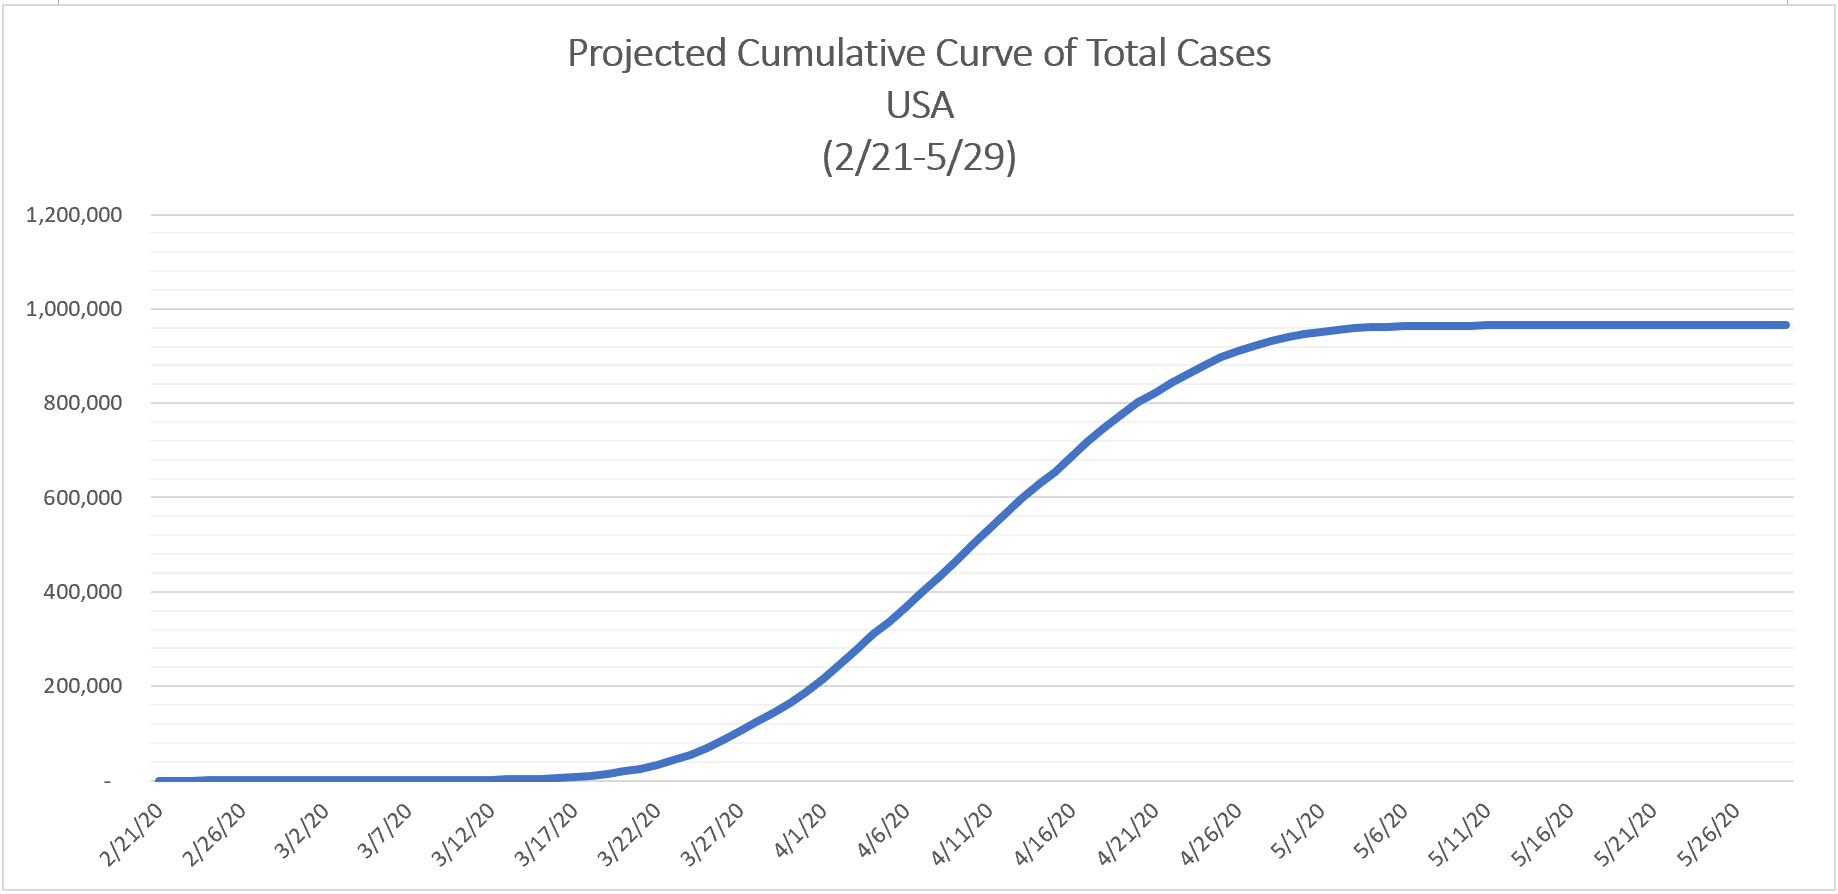
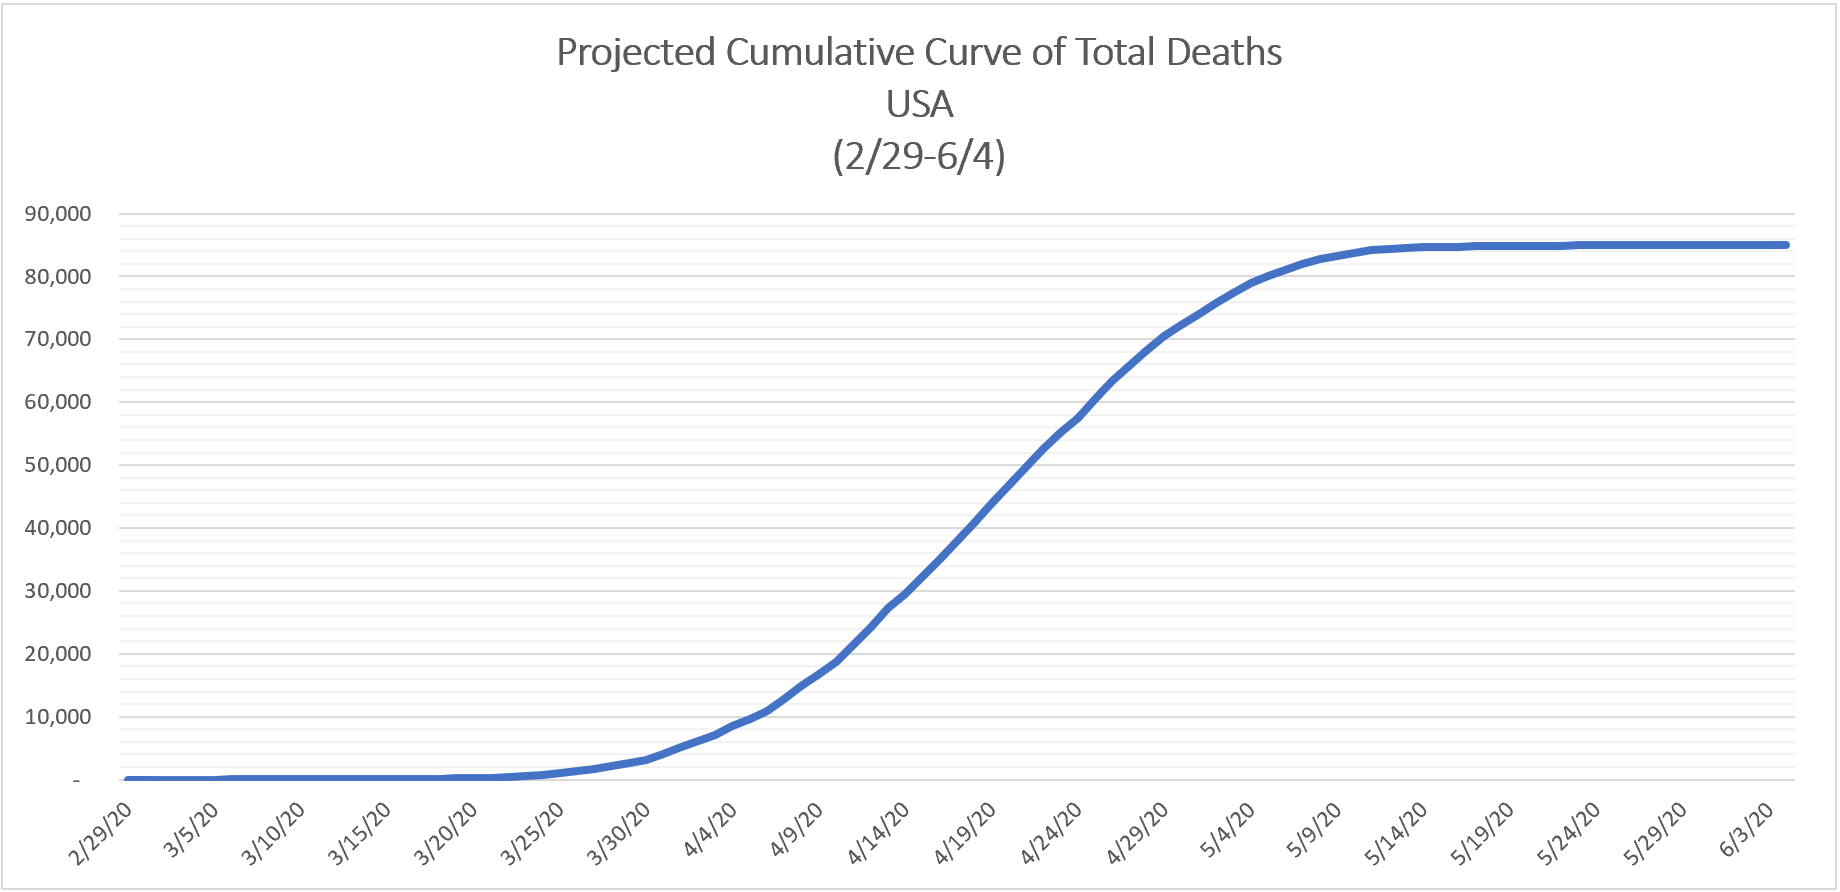
Regression Analysis
We undertake regression from peak day to today to determine the day the daily cases may zero out. Linear regression may not be the best there is, but it's a whole lot better than logarithmic, most polynomials, or power, or exponential. Besides, the forecast accurately auto-corrects the more we reach the tail end.
| Forecast | Forecast | Forecast | Forecast | Forecast | Forecast | |
| April 5 | April 6 | April 7 | April 8 | April 9 | April 10 | |
Australia: | April 15 | April 15 | April 14 | April 13 | April 14 | April 14 |
| Iran: | April 26 | April 25 | April 24 | April 24 | April 22 | April 24 |
| Spain: | May 01 | May 06 | May 03 | May 06 | May 04 | May 04 |
| Switzerland: | May 09 | May 03 | May 01 | May 09 | May 10 | May 07 |
| Germany: | May 12 | April 28 | April 28 | May 08 | May 14 | May 11 |
| Italy: | May 18 | May 12 | May 06 | May 07 | May 10 | May 12 |
| Austria: | -- | -- | April 11 | April 12 | April 13 | April 14 |
| Israel: | -- | -- | -- | -- | April 17 | April 21 |
The forecast dates are holding steady. The regression is not affected much by daily volatility.
Distribution Projection
The closest fit between the projected dates from distribution analysis
(see yesterday’s report) and today’s regression analysis are the (i) precise projected date and (ii) projected date +
one week…. So, take your pick, since it’s all a hazardous projection, anyway. We are safely looking till mid-May
to emerge from the thick forest. Hence, be patient.
Modified Control Chart’ Analysis
The
‘modified’ control charts are still on track to show that all the countries studied are doing better.
Student t-tests
The confidence held and increased for various countries that the number of daily cases are significantly off their peaks, despite today’s fluctuations. The confidence results are given below:
| Confidence | Confidence | Confidence | Confidence | Confidence | Confidence | |
| April 5 | April 6 | April 7 | April 8 | April 9 | April 10 | |
| n1+n2=7 | n1+n2=7 | n1+n2=7 | n1+n2=8 | n1+n2=8 | n1+n2=8 | |
Australia: | 99% | 99.9% | 99.9% | 99.9% | 99.9% | 99.9% |
| Spain: | 90% | 95% | 95% | 99.5% | 99.9% | 99.9% |
| Switzerland: | 95% | 99% | 99% | 99.5% | 99.5% | 99.5% |
| Germany: | 80% | 95% | 95% | 99.5% | 99.5% | 99.5% |
| Italy: | 99% | 99% | 99% | 99.5% | 99.9% | 99.9% |
| Austria: | -- | 99% | 99% | 99.5% | 99.5% | 99.5% |
| Belgium: | -- | 90% | 95% | 95% | 99% | 90% |
| Israel: | -- | -- | -- | -- | 95% | 95% |
The confidence is generally going up, except Belgium, which had a rough day today.
Closure
Hold tight till mid-May!
Time to retreat, reflect, review, rebuild, and
revalue
your life.
Things will not be the same for a very long time to come, even if travel restarts..
PowerPoint |
4/9/2020 |
The battle against COVID is a tough struggle. Israel had a massive resurgence, just
when we thought it was doing very well; Australia is till on track running to finish, though it had more cases today
than yesterday. Same with Austria. Iran continues on a steady downward trajectory.
Turkey, Russia, and
Brazil continue to remain in their highs in daily cases. Canada and USA are struggling to push their daily cases
down.
The world is off its peak for six days in a row, albeit at the second-highest levels. It will be a
month and more before the world comes really down in daily cases. The world is likely to follow the profile of USA
.
Distribution Projection
(1) Days to Zero: We are seeing that it’s taking an
average of 33 days from first onset to peak. With a little imagination, we can assume it may take the same time to decline, but give a week or two more. With this information, we have the following forecast information.
| Country | First Cases |
Peak in Cases |
Days Between First Cases and Peak in Cases |
Projected Date to End |
+one week | +two weeks |
|---|---|---|---|---|---|---|
| Spain | 24-Feb | 26-Mar | 31 | 26-Apr | 3-May | 10-May |
| Italy | 20-Feb | 21-Mar | 30 | 20-Apr | 27-Apr | 4-May |
| Germany | 25-Feb | 27-Mar | 31 | 27-Apr | 4-May | 11-May |
| Iran | 20-Feb | 30-Mar | 39 | 8-May | 15-May | 22-May |
| UK | 23-Feb | 5-Apr | 42 | 17-May | 24-May | 31-May |
| Switzerland | 27-Feb | 20-Mar | 22 | 11-Apr | 18-Apr | 25-Apr |
| Austria | 27-Feb | 26-Mar | 28 | 23-Apr | 30-Apr | 7-May |
| Israel | 23-Feb | 2-Apr | 39 | 11-May | 18-May | 25-May |
| Australia | 20-Feb | 22-Mar | 31 | 22-Apr | 29-Apr | 6-May |
| Average | 33 |
(2) USA analysis: If we have a normal distribution of daily cases for
USA, subsequent to USA
peaking on 4th April (+ 5 days as a cushion), we can expect daily cases to zero out by May 26. The daily deaths will
zero out by June 04, there being an expected lag of 11 days between onset of disease and death. The cumulative
people tested positive, in this case, will be 864,378, and cumulative deaths will be 76,459. The total deaths would
be 8.85% of the cumulative cases. This is nearly 90 times the fatality rate of
influenza.
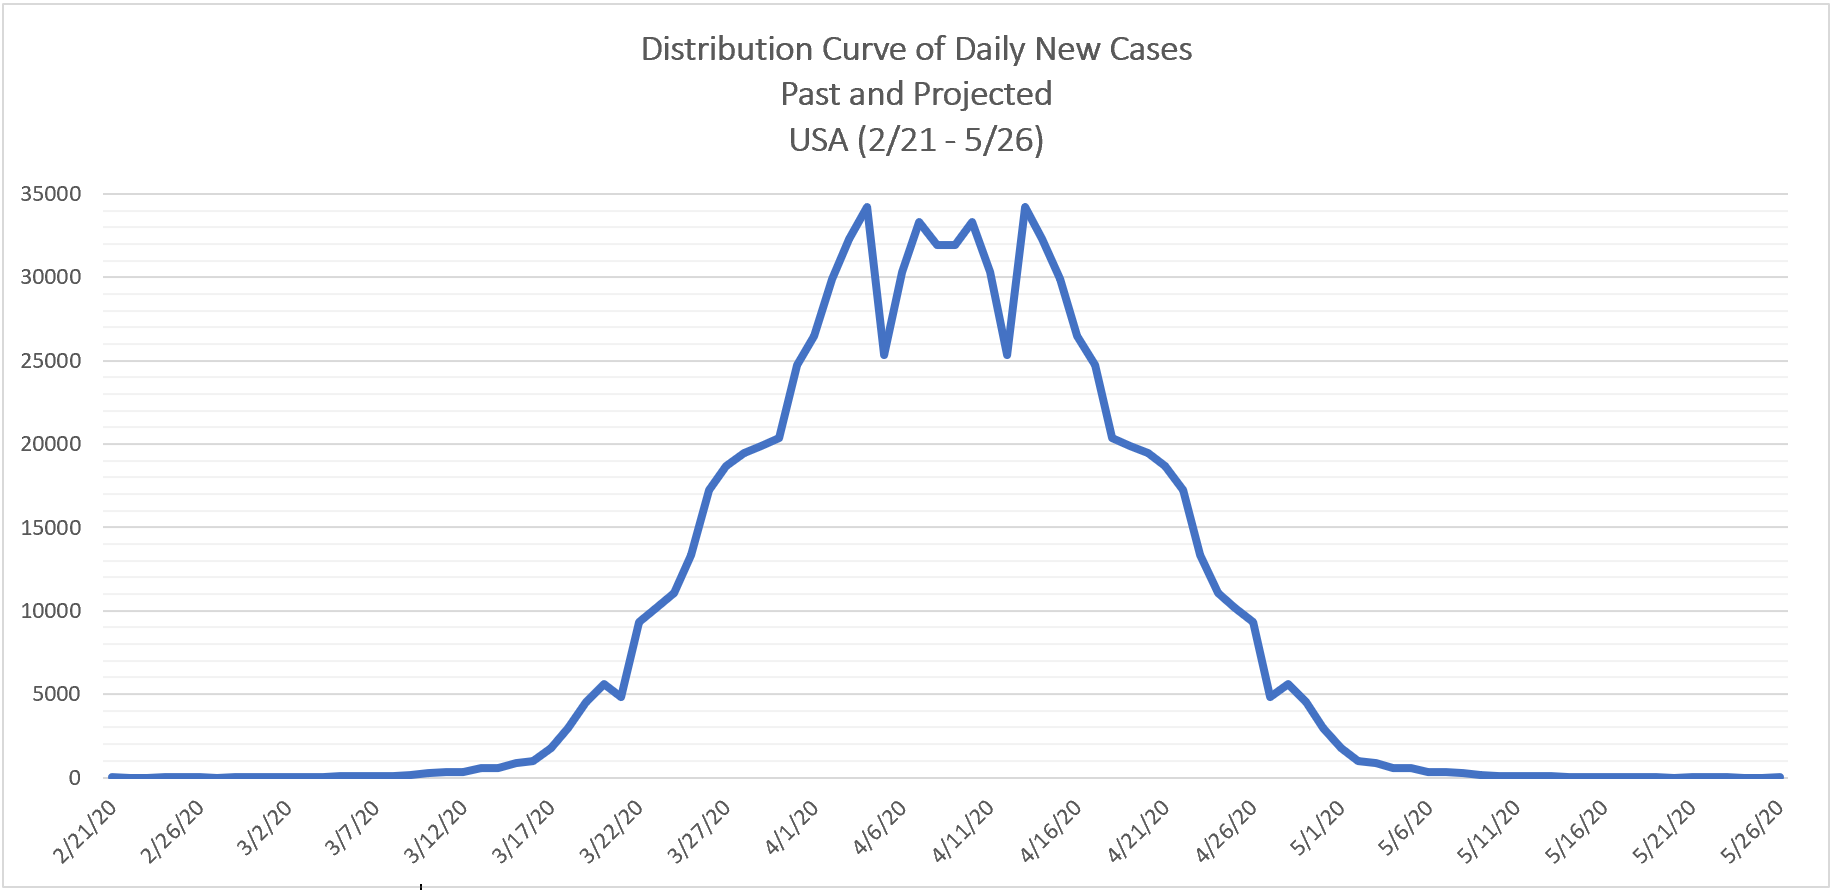
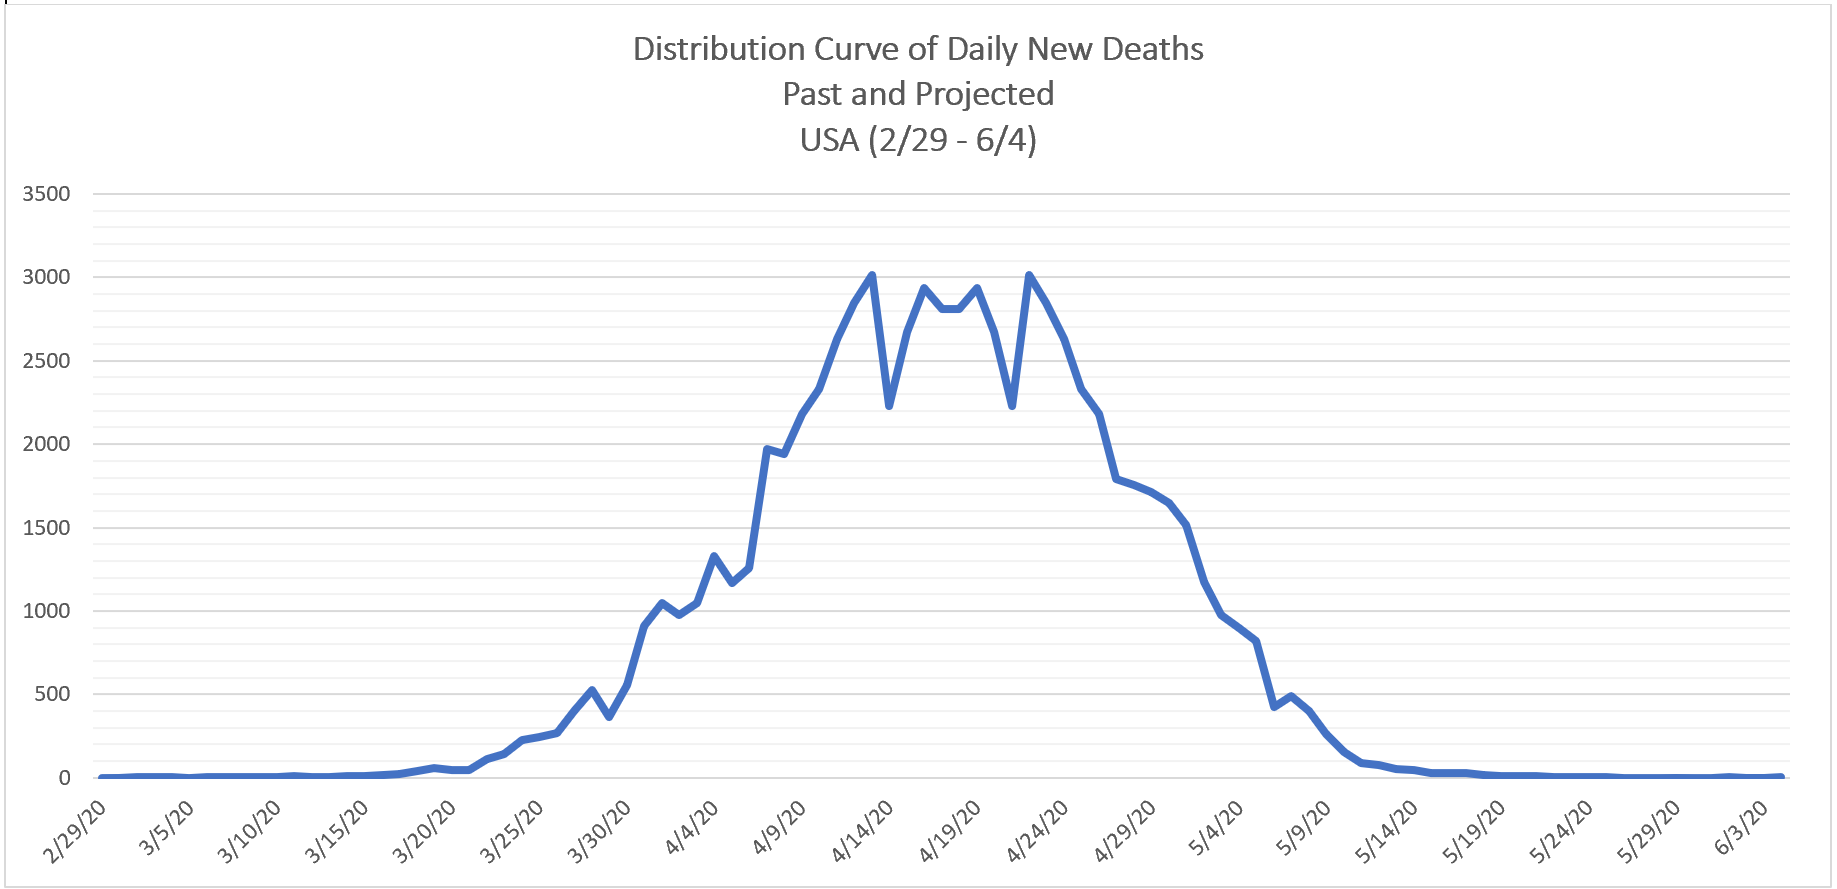
Regression Analysis
We can match the above distribution projection to the regression from peak day to today. Regression reveals the following for daily cases reaching zero or a bare minimum:
| Forecast | Forecast | Forecast | Forecast | Forecast | |
| April 5 | April 6 | April 7 | April 8 | April 9 | |
Australia: | April 15 | April 15 | April 14 | April 13 | April 14 |
| Iran: | April 26 | April 25 | April 24 | April 24 | April 22 |
| Spain: | May 01 | May 06 | May 03 | May 06 | May 04 |
| Switzerland: | May 09 | May 03 | May 01 | May 09 | May 10 |
| Germany: | May 12 | April 28 | April 28 | May 08 | May 14 |
| Italy: | May 18 | May 12 | May 06 | May 07 | May 10 |
| Austria: | -- | -- | April 11 | April 12 | April 13 |
| Israel: | -- | -- | -- | -- | April 17 |
Germany, Switzerland, Australia, and Austria … saw an extension in the projection date from yesterday owing to increased cases today.
There is a poor correlation, -0.28, between the forecast dates above and the projected dates in the earlier section. This is fine, since it is better to get a portfolio of data to get a representative number as the final date. One can then take an average or the 90th percentile or other preferred statistic.
Modified Control Chart’ Analysis
The ‘modified’ control charts are still on track to show that European countries, Israel, and Australia have broken through the curse of the highs and are progressing downward out-of-control. Israel issued a surprise uptick in daily cases today that was as remarkable as it was disturbing. The control charts are given at the end of the power point for today.
Student t-tests
The confidence held and increased for various countries that the number of daily cases are significantly off their peaks, despite today’s fluctuations. The confidence results are given below:
| Confidence | Confidence | Confidence | Confidence | Confidence | |
| April 5 | April 6 | April 7 | April 8 | April 9 | |
| n1+n2=7 | n1+n2=7 | n1+n2=7 | n1+n2=8 | n1+n2=8 | |
| dof=5 | dof=5 | dof=5 | dof=6 | dof=6 | |
Australia: | 99% | 99.9% | 99.9% | 99.9% | 99.9% |
| Spain: | 90% | 95% | 95% | 99.5% | 99.9% |
| Switzerland: | 95% | 99% | 99% | 99.5% | 99.5% |
| Germany: | 80% | 95% | 95% | 99.5% | 99.5% |
| Italy: | 99% | 99% | 99% | 99.5% | 99.9% |
| Austria: | -- | 99% | 99% | 99.5% | 99.5% |
| Belgium: | -- | 90% | 95% | 95% | 99% |
The confidence of ALL countries above has gone up steadily since we started this comparison five days ago. None has come down. This is a robust test to prove we are on the decline in the world, with these countries as representative samples.
Closure
Plan for the long haul.
Best wishes to all.
PowerPoint |
4/8/2020 |
Our analysis of new daily cases of the major countries continues today. Europe sent a surprise today: most major countries exhibited an increase in growth from yesterday. Except France, but France has always been out-of-step with the rest of Europe in this COVID crisis. Though Boris Johnson is getting better, UK saw another climb. Something happened in Europe today, and we hope it's not a second wave starting.
However, a day’s worth of data should not alarm us. Remain calm, clear, consistent, and controlled. Looking at the overall picture, Europe is still on a path to recovery, though today’s numbers did push the regression out a bit. On the positive side, China removed the lockdown in Wuhan, though it’s still tracking via mobile phones where people go. Every Wuhan resident who leaves Wuhan has to mandatorily download an app on their mobile that reveals their position in continuous time!
A great story came from India today: they can see blue skies once again all over the country in major cities – skies that are normally covered with haze, smog, dust, and pollution. Pollution levels have dipped from 400 ppm to 12 ppm. It’s a miracle! The Himalayas can be seen from the plains, 225 km away; the rivers are running clean, as factories have suspended their work and have stopped discharging into rivers. We think the Earth ordered this natural cleanup, though it pains us. In the end, humans don't run Earth – the Earth has its own plan and agenda.
General Trend in Daily Cases
Turkey, Russia, and Brazil continue to strike new highs in daily cases. This can be explained in that they started late, after Europe. Canada climbed, as well. USA’s daily number is below its peak, but USA is still flirting with its highs.
Iran continues to report a steady decline. But, the perfectly uniform decline raises alarm bells as to the veracity of the data. Anyway, we’d rather not be worried about that unless there is evidence to the contrary.
Australia is our poster boy for the day – and true to its social distances (!) – is marching downhill, whistling a tune. Israel has also reported remarkable success; I hope their containment strategies pay off sooner than later. We look positively at Australia and Israel for very good news next week. We wish everyone well.
Regression Analysis
We continue to choose linear regression as our preferred tool for projecting the future. For one, it’s easy to undertake; for another, it doesn’t appear that this simple tool is going to yield results different from more complex models, albeit with some give and take. Our regression reveals the following for when new daily cases will reach zero or a bare minimum:
| Forecast | Forecast | Forecast | Forecast | |
| April 5 | April 6 | April 7 | April 8 | |
Australia: | April 15 | April 15 | April 14 | April 13 |
| Iran: | April 26 | April 25 | April 24 | April 24 |
| Spain: | May 01 | May 06 | May 03 | May 06 |
| Switzerland: | May 09 | May 03 | May 01 | May 09 |
| Germany: | May 12 | April 28 | April 28 | May 08 |
| Italy: | May 18 | May 12 | May 06 | May 07 |
| Austria: | -- | -- | April 11 | April 12 |
Australia is really holding steady --- a great delight. At least, we can clear ONE continent from this nasty virus. Austria and Israel are close in with Australia. Neighbors Germany and Switzerland are doing a sinusoidal variation on us, but they should be down to zero cases in the first half of May if not end-April. These dates are not far off. Europe can look forward to a nice summer for the second-half. Even Uncle Trump spoke of raising restrictions sooner than later, and he has access to all the great models and minds in the world for saying so. But, we said so, too, using only simple analytical tools.
Modified Control Chart’ Analysis
The ‘modified’ control chart gives us a pulse of the progress. Despite the uptick in daily cases in Europe, the control chart still exhibits excellent performance. There are indications that the decline in daily cases may follow a sinusoidal pattern. But so long as the number of daily cases remains below the declining average, we have optimism. Remember that the average line will decline on a daily basis as the cases decline. Then, if the rubrics of the control chart still hold up, we are on solid ground, indeed. The control charts are given at the end of the power point for today.
Student t-tests
Today, we used the FIVE most-recent days to compare the data to the three highest peaks. This test is conclusive in predicting that there is a significant difference between recent trends and the highs. As the confidence rises higher and higher, day-by-day, it is incontrovertible evidence that the daily cases of the recent days are way below their highs. This means that we are reaching the bottom of the right side of the distribution profile. Hallelujah!
The confidence results are given below:
| Confidence | Confidence | Confidence | Confidence | |
| April 5 | April 6 | April 7 | April 8 | |
| dof=5 | dof=5 | dof=5 | dof=6 | |
Australia: | 99% | 99.9% | 99.9% | 99.9% |
| Spain: | 90% | 95% | 95% | 99.5% |
| Switzerland: | 95% | 99% | 99% | 99.5% |
| Germany: | 80% | 95% | 95% | 99.5% |
| Italy: | 99% | 99% | 99% | 99.5% |
| Austria: | -- | 99% | 99% | 99.5% |
| Belgium: | -- | 90% | 95% | 95% |
The confidence of ALL countries above has gone up steadily since we started this comparison four days ago. None has come down. We feel very good about this test as a harbinger of things to come.
Closure
Hang in there. The numbers may play a trick or two in the next few days, but we’ll be out of the woods soon. Hold steady and firm. Stay at the helm and lead your organization with firmness and personal example, using a disciplined approach to manage the virus. Don't give up nor give in.
Be a leader: remain calm, clear, consistent, and controlled.
Best wishes to all who read this.
PowerPoint |
4/7/2020 |
Europe continued on its march to success, with all major countries way below their
peak. UK had another decline in daily cases today, though we do put in a prayer for their Prime Minister, Boris
Johnson. The graph of France shows volatility, albeit still below its maximum peak. We hope all goes well there.
At ISEC, our work is only to monitor the graphs and trends of the major countries, serving as samples for
the rest of the world.
General Trend in Daily Cases
While USA appears to have started a downhill trend, it is still too soon to say that the worst is over. Perhaps in another 3-5 days, we can declare the downward trend as more conclusive.
Iran reports a steady and uniform decline – a very welcome development if the numbers are accurate. But note, that numbers are not 100% accurate in any country owing to reporting challenges.
But, our heart goes out to Turkey and Brazil – two major countries on the world scene – that continue to rise inexorably in their daily COVID cases.
Regression Analysis
Following our report of the last few days, we continue to choose linear regression as the most able predictor of things to come, albeit with a pinch of salt. If the decline truly follows a normal distribution, our linear regression will self correct to earlier and earlier days when the disease is beaten. If the distribution is more logarithmic or a right-skewed beta distribution, the forecast for victory will push outwards. Though probably hard to believe at this stage, our regression reveals the following for when new daily cases will reach zero or a bare minimum:
| Forecast | Forecast | Forecast | |
| April 5 | April 6 | April 7 | |
| Australia: | April 15 | April 15 | April 14 |
| Iran: | April 26 | April 25 | April 24 |
| Spain: | May 01 | May 06 | May 03 |
| Switzerland: | May 09 | May 03 | May 01 |
| Germany: | May 12 | April 28 | April 28 |
| Italy: | May 18 | May 12 | May 06 |
| Austria: | -- | -- | April 11 |
We see that the forecasts for all countries are consistent from day-to-day. But, the stars can probably tell better, because the mathematicians and scientists aren’t much better than astrologers in this regard. Given a choice, I would throw a lot of weight behind the astrologers, having seen the inaccuracies put out by erudite scientists and reputable statistical organizations. We are fortunate, because we are humble and do not claim too much.
These values are by no means cast in stone, but are a representative measure of the things to come. Take it as you will, but we’ve done basic footwork for you.
Modified Control Chart’ Analysis
A ‘modified control chart’ analysis also reveals all countries in Europe are “out of control” in their daily cases. If you’ve been following our previous reports, the average line will keep going down day-by-day if daily cases continue to decline, which is what we want. For once, we want the data to spin out-of-control. We analyze the data using standard rubrics of control chart visual analysis. We believe the data should visually speak out, else trying to fathom hidden trends, as statisticians and mathematicians are wont to do, is an exercise in futility. Simply said, we always want new points to be below the average line. This chart gives us useful tips when combined with regression and statistical t-tests.
Hence, we see that every country in Europe and Australia is going out-of-control in the right direction. The results are even better today than yesterday. As far as Australia is concerned, I reckon that the distances there are so great that social distancing is not a problem (hehe!). The world is coming back.
Student t-tests
We compared the data by using the Student t-test on daily cases for the most recent four days with that of the three highest peaks. As the daily cases continue to decline, our confidence measure of predicting a measurable decline from the highs, increases. This test is conclusive.
The confidence measures of the last few days are as follows:
| Confidence | Confidence | Confidence | |
| April 5 | April 6 | April 7 | |
| Australia: | 99% | 99.9% | 99.9% |
| Spain: | 90% | 95% | 95% |
| Switzerland: | 95% | 99% | 99% |
| Germany: | 80% | 95% | 95% |
| Italy: | 99% | 99% | 99% |
| Austria: | -- | 99% | 99% |
| Belgium: | -- | 90% | 95% |
These results clearly show that the confidence is staying the same or going up – a sign of success. The greater the confidence in measuring differences in daily cases from the peak values, the more conclusive the results that the level of daily new cases is going down. It’s cause for raising your spirits. I think the whole world needs a holiday once this crisis is over!!
We didn't measure Iran on the t-tests – an important country in this time – because we don't know whether to rely on that data or not. The same thing goes for China and India, albeit for different reasons. However, it is quite certain that China and South Korea are success stories in handling the virus.
Logistic Curve Visual Analysis
The logistic curve – an S-curve – is simultaneously flattening for the countries for which we did t-tests, thereby corroborating the t-tests, linear regression, and ‘modified’ control charts. Every test is matching up. Thus, it is time for all to take in that deep breath and relieve yourselves.
Closure
Hang in there: the Americas will also recover. USA and Canada are showing initial indicators of healing.
There is no shortage to relief from the one who gives us the pain. Surely, humans will have learned a lot from this crisis – on kindness and compassion, for instance. We hope the world will be a better place for what transpired.
PowerPoint |
4/6/2020 |
All across Europe, major countries reported lower daily cases in those we continue to
analyze. We believe that the story in the major countries is a bellwether for the smaller countries. So, if there
is hope for the major countries affected, there is hope for the rest of the world.
Spain, Italy, Germany,
France, Switzerland, Austria, Belgium … continue to decline. Austria’s distribution profile is virtually a perfect
normal distribution, as good as it can realistically get. Other countries have a long skew (tail) to the right, a
typical right-skewed beta distribution. The tail affects when the countries will recover.
Even UK – where
its Prime Minister is unfortunately in an ICU because of COVID – had a respite in growth today. USA, Brazil, and Canada also had a decline in growth or a value of daily cases lower than their respective peaks. Even the worldwide daily cases fell three days in a row. I can confidently say that the worst is over in Europe, and will soon be so for the Americas, as well. And, the world is definitely on the mend. The lockdown strategies are working.
We were back to using linear regression today to project from the peak values to today and beyond. For one, the value of x when y=0 keeps reducing as daily cases reduce, indicating that the slope of the regression line becomes steeper in the downward direction – a welcome sign. This indicates more and more that the distribution of this virus might be either normal or a beta with a slight skew to the right. Hence, as the system corrects itself, our predictions become more and more accurate. Today’s prediction levels for when new daily cases will reach zero or a bare minimum are:
These values are by no means cast in stone, but are a representative measure of the things to come.
You may wonder why we focus on daily cases, and not deaths. That’s because deaths are simply a function of daily cases. If daily cases reduce, there is no way that deaths can rise. Remember, though, that deaths lag the onset of cases by 11 to 21 days.
A ‘modified control chart’ analysis also reveals all countries in Europe are “out of control” in their daily cases. But, unlike in manufacturing, we want the ‘production’ of daily new cases to go out of control. In this analysis, “out of control” is good if the cases are declining, but bad if rising. The average line keeps going down day-by-day if daily cases continue to decline, which is what we want, and so the bar also goes down, which is also fine with us. Whereas, the upper and lower control limits coincide with the average in this modified analysis, the trend analysis of the data can still be undertaken using standard rubrics of control chart analysis. Simply said, we always want new points to be below the average line. This chart gives us useful tips when combined with regression and statistical t-tests.
Hence, we see that Spain, Italy, Germany Switzerland, and Australia are all going out-of-control in the right direction. The world is coming back.
Student t-test statistical analysis for Italy, Spain, Switzerland, Germany, Austria, Belgium and Australia clearly show that the recent four consecutive days have significantly lower daily cases than the three days with the highest peaks. As the daily cases continue to decline, our confidence measure of predicting a measurable decline from the highs will continue increasing. This test is conclusive of the recent trends. Better than yesterday, we can now say with a confidence of 99.9% that Australia is down from its peak values. Italy, Switzerland, and Austria, are down with 99% confidence. There’s no going back owing to the nature of this distribution and the lockdowns in place. Spain and Germany are significantly lower from their peaks with 95% confidence; and Belgium is down with 90% confidence. What these samples say is representative of the entire population of Europe. The COVID-19 menace is ending soon, and we’ll be able to get back to our normal lives in due course.
The logistic curve – an S-curve – is simultaneously flattening for the countries in the previous paragraph, thereby corroborating the t-tests and the linear regression and control charts. All our engines to stop COVID are firing on all cylinders. Every test is matching up.
And, Iran, if their numbers are to be believed, are down from their peak for 7 days in a row. But, the daily cases rose today in Turkey. This virus has to disappear from every country to make it disappear from Earth.
The miracles that we wanted may well be on their way. Owe it to human effort and the kindness of the one and only one above.
PowerPoint |
4/5/2020 |
In all this frenzy of COVID, with police ruthlessly blaring loudspeakers on a quiet beach on a sunny Sunday in Waikiki, let us observe that there is plenty good news coming from Europe, despite the gloom and doom of increasing deaths. In any event, one must never look at the cumulative numbers of active cases or total deaths, because those are bond to depress.
We observe that Italy, Switzerland, Spain, Belgium, Netherlands, Germany, Austria, Norway, Portugal, Australia …. are on a declining trendline. Regression analysis from the maximum peak to today reveals that the slope is downward for them. It is always a challenge, however, to use an appropriate trendline, because some polynomials and profiles give negative or imaginary solutions. After applying simple judgment, we discovered that while Spain’s profile responded well to a fourth order polynomial, all the other countries did well with simple linear regression.
At the decline predicted by regression analysis, dates are given below when the stated countries will likely have
zero daily cases. These are among the top countries with a large number of cases:
These values are by no means cast in stone, but are given to show that the light at the end of the tunnel is
around the corner.
A ‘modified control chart’ analysis also reveals all countries in Europe are “out of control” in their daily cases. In this analysis, “out of control” is good if the cases are declining, but bad if rising. The average line keeps going down day by day if daily cases continue to decline, which is what we want, and so the bar also goes down, but that is fine with us. Whereas, the upper and lower control limits using standard deviation coincide with the average in this modified analysis, the trend analysis of the data can still be undertaken using standard rubrics of control chart analysis. Essentially, we always want new points to be below the average line. So long as the process is “out of control” in the downward direction only, we have good hope. This chart gives us useful tips when combined with regression and statistical t-tests.
Hence, we see that Spain, Italy, Switzerland, and Australia are really going in the right direction.
The increasing number of deaths worldwide and each country can be misleading. That’s because –
- Deaths will lag new cases by 8-14-21 days,
- If the daily cases were at a high 8-14-21 days ago, the corresponding deaths were high yesterday and probably higher today, and
- As daily cases decline, the daily deaths will reduce only in due course.
The trouble is that people are impatient and want to see instant results – like instant coffee, microwaveable food, instant gratification … but bio systems don't respond instantly. Only miracles can be instantaneous, and those don't come easy.
Further, t-test statistical analysis for Italy, Spain, Switzerland, Germany, and Australia clearly show that the recent four consecutive days have significantly lower daily cases than the three days with the highest peaks. This test is conclusive of the recent trends. Italy and Australia are significant at 99% confidence; Switzerland at 95%; Spain at 90%; and Germany at 80%. The higher the confidence, the surer the difference. The results clearly show we are convincingly seeing declines in daily cases in those and many other countries. Very soon, we should be out of the woods.
Looking at the logistic curve – the S-curve -- which is common in epidemic and pandemic analysis, the curve has flattened out for China and South Korea. Italy, Spain, Germany, Switzerland, Austria, and Australia are past the inflection point, indicating that the growth slope is less than 1.0. France has had a fantastic two days after a disastrous day on April 3, somewhat replicating the profile of China, but 50 days later. Belgium and Netherlands are at the inflection point, having reached there after exponential growth earlier. Verily, Buddha is smiling on Europe.
We have regression, control chart analysis, t-test analysis, and logistic curve slope analysis to show that Europe is – by and large – emerging from this devastating crisis. Instead of focusing on Spain exceeding Italy in the total number of cases, focus on Spain having fewer cases than its peak for 10 days in a row; Germany 9 days in a row, Switzerland 16 days in a row; and Italy 15 days in a row. With a virus such as COVID-19, 8 to 21 days is within a meaningful period, considering that the gestation period from onset to clearance or death is about that many days, in general.
And, Iran may have well turned the bend, as well, hallelujah; otherwise hell might have broken loose. They’ve been down from their peak for 6 days in a row. We’re all in this together, and the virus doesn’t discriminate between friend and foe.
Worldwide growth declined today (Sunday) by 15.8%, declining two days in a row. Brazil and USA had a respite today, probably perhaps because it was Sunday and people often don’t go to doctors on a Sunday. But, Canada, UK, Turkey, and Netherlands continued upwards. These countries have a tough row to hoe for another two weeks yet, USA especially so owing to its vast population.
At the rate the USA is going, our calculations show that USA could easily have 125,000 deaths. If it’s any consolation, this number is way below the 675,000 Americans taken by the angel of death during the Spanish Flu of 1918. God taketh, but he giveth.
Sorry, we can't analyze every country in the world owing to a resource shortage, but we are focusing on countries with the most cases. Let’s see what tomorrow and the next two weeks bring. Without a shade of doubt, your fate is in your ‘hands’. Whether we get a second wave or not must really be observed in the Fall season.
For the first time, strangely, the world is united, largely putting aside its petty differences for the short term. We sure hope this momentum of kindness can be carried into the future, much as World War I drew to a close after the devastating outbreak of the Spanish Flu.
PowerPoint |
4/4/2020 |
One must observe that Italy, Switzerland, Spain, Belgium, Netherlands, Germany, Austria, Norway, Portugal, Australia …. are on a declining trendline. A simple regression from the maximum peak point reveals that the slope is downward. Linear regression is very logical to use, as it gives a representative answer, anyway, and especially because the exact profile is inaccurate to plot, and because the best fit regression up to now is unlikely to be able to project properly into the future. The attached power point carries linear regression trendlines for Italy, Spain, Germany, and Switzerland.
These may sound depressing, and linear regression isn’t the best regression, either, but we are only presenting results of specific analyses. These values are by no means cast in stone, but are given to show that there is light at the end of the tunnel.
A control chart analysis also reveals that numerous countries in Europe are “out of control” in their daily cases. In this analysis, “out of control” is good if the cases are declining, but bad if rising. Though our sample size is one for each day, we have more than 10 subgroups, having started our analysis on March 19. Whereas, the upper and lower control limits coincide with the average, the trend analysis of the data points can still be undertaken of, for example, whether four out of five consecutive points, etc. are below the lower control limit. Other control chart trend analysis guidelines can also be utilized. So long as the process is “out of control” in the desired direction, we have good hope. This is not a rigorous control chart analysis, but gives us useful tips when combined with linear regression and t-tests.
The increasing number of deaths can be misleading. That’s because –
- Deaths will lag new cases by 8-11-14 days,
- If the daily cases were at a high 8-11-14 days ago, the corresponding deaths were high yesterday and probably higher today, and
- As daily cases decline, the deaths will reduce only in due course.
People are impatient and want to see instant results – like instant coffee, instant gratification … but bio systems don't respond instantly. Only miracles can be instantaneous, and those don't come by easily.
Further, t-test analysis for Italy, Switzerland, Germany, and Austria clearly show that the recent four consecutive days have significantly lower daily cases than the three days with the highest peaks. Italy is significant at 99% confidence; Spain and Germany for 80%; and Switzerland for 90%. The higher the confidence, the surer the difference. The results clearly show we are convincingly seeing decline in the daily cases in those and many other countries. Hence, don't look at cumulative case numbers because those will always increase, and you’ll continue to feel depressed looking at them.
Look, we have regression, control chart analysis, and t-test analysis to show that Europe is – by and large – emerging from this devastating crisis. Instead of focusing on Spain exceeding Italy in the total number of cases, focus on Spain having fewer cases than its peak for 9 days in a row, Germany 8 days in a row, and Italy 14 days in a row. With a virus such as COVID-19, 8-14 days is within a meaningful period, considering that the gestation period from onset to clearance or death is about 8-14 days.
And, Iran could have turned the bend, as well, hallelujah; otherwise hell could have broken loose. They’ve been down from their peak for 6 days in a row. We’re all in this together, and the virus doesn’t discriminate between friend or foe.
Worldwide growth declined today by 16.5%; this is the third time that worldwide growth declined from the previous day, only to rise again with vengeance; so, nothing to open champagne for.
Even UK had a respite in growth today, but not USA or Canada or Brazil or Turkey. Sadly, Turkey has climbed to the ninth spot in the world for total cases. But, Australia has shown a remarkable decline, and we’ll do regression for Australia tomorrow, since there is promise there.
Sorry, we can't analyze every country in the world owing to a resource shortage, but we are focusing on countries with the most cases.
Let’s see what tomorrow brings. But note, tomorrow is Sunday, and reporting may not be complete till Monday. As it is, we are sometimes frustrated that Worldometer, from where we collect our data, revises its numbers for daily cases a day or two later.
God bless and best wishes. Take care of yourself and the family.
PowerPoint |
4/3/2020 |
Good News:
Italy is down from its peak in daily cases for 13 days in a row; Spain, 8; Germany, 7; Switzerland, 13; South Korea, 27 days; Belgium, 6; Netherlands, 7; Austria, 9; Portugal, 3; Norway, 7; and Australia, 12. Many of these countries, such as Belgium, Netherlands, Australia appear to have gone through a “second wave,” albeit with a lower crest than the first wave. So long as the daily cases decline, we’ll take it.
We can statistically see that the numbers of daily cases for the past three days (including today) are significantly lower than those around the peak days for Italy, Germany, Switzerland, Belgium, Netherlands, Austria, Norway, and Australia.
Even Iran showed the first signs of moving lower from its peak rather than going up, and is being held in check for the past week. Worldwide growth was muted at 4%.
Bad News:
The Western world has now been afflicted for about a month. Whereas, there are countries that are registering fewer daily cases than at their peak, it does look as if the climb down will be at least as long as the climb-up, if not longer. That is the troublesome part. This pandemic could easily take another six to eight weeks before daily case levels are down to an incidence rate whose corresponding deaths equal those of the common flu, about 0.1%. At that time, countries may begin to think of lifting the travel ban. The probability of contracting COVID-19 at that stage could be 40 times less than contracting the plain flu virus.
USA, UK, Canada, and Brazil continue to climb inexorably. While the UK is behind the rest of mainland Europe by about a week, and USA and Canada are behind UK by another week, Brazil is behind USA by yet another week. Turkey and Israel are running behind, as well.
The greatest surprise was France, which saw the worst increase of any country in any single day (growth = 12.3 times). This just shows what the virus is capable of.
UK and USA grew; Brazil and Turkey are still in their highs. Though Israel had a decline in growth today, it’s much too soon to tell. USA will climb a lot more in the days to come owing to its mammoth population.
The crisis in USA is yet to reveal itself, especially if the number of serious cases outstrips the number of ventilators. That said, it’s already horrible if one has to go on a ventilator; and the ventilator is not a certain cure. Most of the people who die have been on ventilators. We don't have the statistics yet as to what percentage of people who have been on ventilators survive.
All that said, let's continue to keep our fingers crossed, and our hands washed. Keep doing your work where you are, and pray to God alongside. We don't advise people to carry a 4 ft long stick to measure their social distance from people because that can lead to unintended consequences.
God bless and best wishes.
PowerPoint |
4/2/2020 |
The world continues to see an increase, with the major numbers coming from USA. We
must remember that the USA is a huge country – the largest in the Western Hemisphere -- and so its numbers are
expected to be larger than those for any country in Europe. Next, USA has a time lag to Europe – anywhere by about 7-14 days, so USA will get worse before it starts to get better.
Italy is down from its peak in daily cases for 12 days in a row; Spain, 7; Germany, 6; Switzerland, 13; and South Korea, 27 days. France has seen a remarkable decline for the past two days, with today’s daily cases being 44% of the previous day’s; and day-before’s cases being 64% from the day before that. Even UK, which was jumping ahead as if there was no ceiling, had a respite today, with its growth declining for today. In fact, today is looking better than yesterday for Europe.
We can statistically see that the numbers of daily cases for the past three days (including today) are significantly lower than those around the peak days for Italy, Germany, and Switzerland
Even Iran has not burst out, but is being held in check for the past six days. Worldwide growth was muted at 3.7%.
The seesaw in daily cases for both Cyprus and Hawaii continued today. The correlation of cases between these two islands is significantly high.
For various days recently, China has reportedly had zero daily cases. South Korea has no lockdown, but it has used other techniques to fight the virus.
We are finding that Worldometer sometimes revises its data of earlier days, because all data doesn't always come in the next day. Hence, we also have to revise our charts accordingly.
All that said, let's continue to keep our fingers crossed, and our hands washed. Keep doing your work where you are, and pray to God alongside.
The one lesson we need to learn from this pandemic is to raise the worldwide hygiene standards of the way we slaughter, handle, and store meats across the board – especially in the emerging countries. We’ve seen that what happens there affects the whole world.
God bless and best wishes.
PowerPoint |
4/1/2020 |
Italy is down from its peak in daily cases for 11 days in a row; Spain, 6; Germany, 5; Switzerland, 12; and South Korea, 26 days. This is a sign that the virus is being held in check by the measures taken by humans.
The average growth of the past five days has been lowest yesterday in USA over the past six days. For Italy and Germany, this growth has fallen below 1.0.
Even Iran has not burst out, but is being held in check for the past six days. Worldwide growth was muted at 4.3%.
Cyprus and Hawaii had their largest daily cases today. The correlation of cases between these two islands is significantly high despite their daily volatility, or perhaps because of it.
The numbers coming out of China and India are unreliable – for different reasons -- even as a United Nations Report said that China and India will be least affected economically as a result of this virus. Let’s see.
This virus has to be beaten, so hang in there and continue to take standard cleanliness precautions.
All that said, let's continue to keep our fingers crossed, since each day is a new day.
God bless and best wishes.
PowerPoint |
3/31/2020 |
Let’s continue to pursue the analysis strategy we started earlier and formalized yesterday for the major countries afflicted by COVID-19.
Italy is down from its peak in daily cases for 10 days in a row; Spain, 5; Germany, 4; Switzerland, 11; and South Korea, 25 days. These are positives.
USA, Italy, Spain, Germany, Iran, UK, and Switzerland had lower 5-day moving averages of growth than the last five days for which that data was measured. Following on what we said yesterday about USA’s possible growth decline by 2% a day, the 5-day moving average may be a better marker than the daily volatility which can make anyone dizzy. Indeed, when we want to look at the whole forest, one has to look past the trees. There are signs of the end of the tunnel, here.
While Uncle Trump is right to ask everyone to be on alert for the next 30 days, he’s taking giant steps for another $2 trillion stimulus for infrastructure, as well as using the low prices of oil to top up strategic oil reserves to ensure that the free world will not be found wanting in case another shoe drops.
France, UK, and USA saw new peaks today, but we’ve already asked you to look beyond daily volatility. UK seems to be statistically in the same zone for the past four days, and Iran for the past five days. USA’s 5-day moving average growth rate is declining;
The world’s total daily cases increased today largely because of the jump in France and the growth in USA. Despite this fact that can scare people, the world’s average 5-day moving growth average was lowest today (Table 1).
It’s also important to look beyond the daily volatility of Cyprus and Hawaii, and observe that Hawaii is off its peak value for 3 days in a row, and Cyprus for 2 days in a row.
Sometimes it’s good to look at the positives to keep one’s spirits intact.
All that said, let's continue to keep our fingers crossed, since each day is a new day.
God bless and best wishes.
PowerPoint |
3/30/2020 |
Instead of focusing on all the bad news coming at us, let’s look at the analysis
slightly differently today.
All major countries in Europe are off their maximum peaks today, i.e., despite varying growth and decline in different countries, none of them has exceeded their prior peak of daily cases. We must look for patterns in all this data, rather than blowing with the wind.
Italy is down 9 days in a row; Spain, 4; Germany, 3; France, 2 (though it rebounded today compared to yesterday); UK, 3; Switzerland, 10; and South Korea, 24 days. Europe is looking good on this count.
Iran is the only country, along with USA that is bucking the trend, although for different reasons. Iran, because of its total destitution; USA, because it was late on the scene compared to Europe.
The graph for China continues to feel strange. On Feb 12, China peaked to 14,108 cases, but fell down the next day to 5,090, and the day after to 2,641. Anyone can tell you that this type of decline is not visible in any other country. Again, the rise and fall of epidemics is usually close to a normal distribution or a beta distribution with a right skew. China does not display that behavior. Hence, we feel that something doesn’t look quite right with the data from China.
The USA has been climbing daily, albeit at a slower pace every day since March 26. Yesterday and day-before, USA’s growth was in the 2-2.5% range only, a far cry from the 29% on March 26 and 20% of March 25. If US growth drops by the 2.64% average decline since the past 5 days, USA could be out of the woods quite soon. But, that’s looking at the optimistic side.
On the pessimistic side, if USA’s growth averages that of the last five days of 9.2% for the rest of time, 42 million people in USA will be infected by 60 days, and 761,000 people would have died, if you follow the current death rate. But, if the number of serious patients outstrips the number of ventilators, the death rate could rise. God forbid!
(Yesterday’s data for USA was re-updated today at our data source – not our fault -- but that changes are report for USA yesterday to that extent).
Even tiny Hawaii has been off its peak for two days, and Cyprus for a day. We are tracking the correlation between Hawaii and Cyprus because, for one, they are island populations of the same size.
So, there are patterns to be seen. Let's not forget the forest while looking at the trees; let’s not forget the larger picture while looking at daily volatility.
But, let's continue to keep our fingers crossed, since each day is a new day.
PowerPoint |
3/29/2020 |
Every major country (top 10, except USA) registered a decline in COVID-19 growth
from
5 pm yesterday to 5 pm today, including Iran. China has minuscule numbers compared to their peak on Feb 12.
Switzerland has been below its peak for nine days in a row; Italy for eight days in a row. This is hopeful
evidence that they are over the hill. Each of them took ~3 weeks to reach their peak, from March 1 to 21. So, with
some reasoning, it'll take 3 more weeks after Mar 21 for them to come down.
Spain has been down three days
in a row, but still took 21 days to reach its peak. They were a little behind the rest of Europe to catch the
virus. The USA, in turn, is another 7-odd days behind Spain.
But, seeing the case in South Korea, the rise
and fall distribution curve is not exactly a normal distribution, but is skewed to the right (longer tail to the
right). So, even if the recovery is longer than 3 weeks, we would have a dramatically lowered incidence rate and
also a lower expectation probability of catching the virus.
After today's promising data, it's not impossible
to expect some travel bans and lockdowns to be lifted by April 30. But, let's continue to keep our fingers
crossed, since each day is a new day.
Keep hope!
PowerPoint |
3/28/2020 |
There appears to be no let up in worldwide growth; all major countries, including S Korea, but save China, registered positive daily growth yesterday. There is no mathematical answer to how long this will continue in this exponential growth. We only realize that it is conceivable for the entire world population to be afflicted, though 80% will recover with ease, while 1.5%-10% will be fatal, and while another 10-15% will fare medical hardships.
The growth will only be curtailed in the world by strict lockdown measures and enforcement of quarantine; the virus itself “could” get exhausted by warming temperatures, though March is peak season for flu, anyway. The virus found the best time to attack the human population – in winter – when humans are most vulnerable to coronaviruses. We simply hope there is no conspiracy behind this entire pandemic.
Though Italy has registered positive growth for the average of this past week, it has a redeeming feature in that the ratio of its 3-day average for daily cases to its maximum peak, over the past seven days, has been below 1.0. Our hearts to go out to the struggle of the Italians and the large number of deaths in Italy. We were relieved to hear of the prayer by the Pope during mass today.
Though a swallow or two doesn’t make for summer, we notice that Spain has witnessed a decline these past two days. Let’s hope this holds up, especially since Spain witnessed daily growth for the past four days prior.
Germany and France are still at their highs, while Iran reached an all-time high. UK experienced a decline yesterday.
South Korea is still sparring with its second wave; it is worrisome that S Korea has not been able to reduce the daily cases in this second wave since two weeks. Up until now, South Korea has been extolled as a model country for fighting COVID-19, so let’s hope it can keep up and increase its momentum of doing so.
Tiny Cyprus and Hawaii both registered a growth today. Hawaii saw its largest daily rise today. Interestingly, there is some correlation between the daily cases of Cyprus and Hawaii. At 5% significance, the correlation yesterday of the 5-day moving average was 0.74, while today it is 0.68. We wonder why they are correlated to each other and not well correlated to the major countries.
The ratio of the maximum daily cases of recent three days to the maximum peak rose for every country today. Whereas, we realize that this ratio can never exceed 1.0, we see that this ratio is perilously close to or above 0.9 for most countries. This simply means that countries are seeing new highs on a daily basis.
Let’s see what tomorrow brings; each day is a new day with COVID-19! We hope for the best, and hope that things will
be better by April 15.
What to do?
- Take care, but don't worry. This will pass.
PowerPoint |
3/27/2020 |
The growth in Italy, Spain, China, and South Korea is holding statistically steady.
This is
always welcome
to hear. Growth above 1.0 is what we definitely don’t want. Of course, the actual new cases in China and South Korea are miniscule compared to their past highs.
Table 2 is particularly informative of the state of the world, where the average of three days new cases to max peak is actually still very high for the European countries, approaching a massive ratio of 0.9 for most of the European countries and Iran.
Moreover, we are statistically not out of the woods yet, because the average growth of the last five days is above 1.0 for every country considered.
The average growth to our baseline of 3/19/20 (when we started this study), is going through the roof for USA, UK, Spain, and Iran.
Italy has good news, in that for the past six days in a row, its new cases have been lower than the peak. Let’s hope this is a sign that the virus will come under control. Its new cases have been in a steady, nominal control band of between 5,000 and 6,000 cases daily.
Germany, UK, and USA reached a new peak today. Boris Johnson caught the bug after Prince Charles yesterday. It’s a good idea to stay clear of the big politicians – they are the ones coming in contact with the most people!
Let’s see what tomorrow brings; each day is a new day with COVID-19! We hope for the best, and hope that things will
be better by April 15, though the world situation may get worse in the next week.
What to do?
- Hang in there! Take the lockdown seriously. If you must go walk at the beach, stay clear of people. Swimming in the ocean is perfectly ok, too, so long as you are not prevented from getting into the ocean park.
- To avoid the problem of lack of exercise at home, invent any number of ways to exercise at home.
- Stay hydrated! Stay hydrated!
PowerPoint |
3/26/2020 |
The following are the facts today:
The world – and USA, Germany, France, UK, Spain, and Iran saw new peaks today in daily cases. The world increased its daily cases by 60,000. Besides, there may be many more out there that experienced mild symptoms from COVID-19 and did not even get tested. There is no evidence yet that these countries above are close to the inflection point. With a ratio of the three-day average to max daily cases running at 83.9%, the growth for the world is headed for the sky.
All countries, except China, but including Italy and South Korea had positive growth today. China and South Korea appear to be on their second wave of cases; alternately, we could look at the tapering-off curve as extra-long for China and South Korea. This may be because China and South Korea both do not have lockdowns currently. But, the methods they have chosen to fight COVID-19 are not those that the rest of the world can easily adopt.
As we reported yesterday, China took a nominal ~18 days to reach its peak, while South Korea took ~12 days. Whereas, the logistics curve is appreciable in that once the inflection point is reached, the growth factor decreases, the logistic curve distribution of the actual dissipation of cases appears heavily skewed to the right. This means that lockdowns and social distancing must be taken with even greater seriousness.
However, it is still a wild guess at present to decide when the European countries and USA will reach the inflection point. It will be a day to celebrate when that happens, because the world’s outlook will immediately turn positive. However, the inflection point isn’t really passed in a day, because only after you get three to six descending control points can you be somewhat confident that the virus may have run its course.
Let’s see what tomorrow brings; each day is a new day with COVID-19!
What to do?
- Prayer and discipline must be undertaken side-by-side.
PowerPoint |
3/25/2020 |
The following are the facts to consider for today:
After the growth reaches 1.0 for 3 to 5 days over a 3-to-5 day moving average, we can assume that the inflection point has been reached. After that, the subsidence in the logistic curve will take as much time as it did to reach the inflection point. But, nothing is as perfect in reality as it is in pure mathematics. So, give and take a bit.
At present, the world is on a growth roll. Average daily growth is still around 10%, which is very high. Each day brings a higher number of daily cases to the world. Of course, we know that the growth curve will increase before it will decrease. And, the growth curve will definitely decrease by the laws of nature. But, we don’t know how long that will be. If South Korea is a guide, they got the virus under control in TWO WEEKS. But, the rest of the world is not South Korea!
It’s definitely not looking like we are close to the inflection point for most Western countries. (Ignore China and South Korea from this discussion because they appear to have the virus virtually arrested). As bad as Italy’s deaths are, that much Italy holds the greatest promise of reaching the inflection point based on the performance of the last four days when its daily cases have been below its peak.
USA, Spain, and Iran are strange bedfellows, in that they are showing no let in their growth. Iran has re started on a high upward trajectory that does not bode well. In USA, 50% of all cases are reported in New York. We wonder why that is, and can only explain it by observing that New York is the center of the immigrant population, and that a lot of travelers simply stop in New York. The high density of population there doesn’t help.
Germany exhibits hope because its total daily cases are less than its prior peak for the last four days in a row. But, its ratio of the average of the last three days to peak daily cases is getting higher. So, Germany could go in either direction in the next few days to come.
Together, Germany, France, and Italy are the best performers in Europe.
Cyprus and Hawaii are small population islands, and they were looking good today. They may perhaps be able to arrest the virus because they have strict lockdowns in place, including travel restrictions. But, being small populations, the data is likely to be less consistent, as well. We’ll keep watching these.
But, the world, as a whole is looking like it’s a long way from home. Stay positive, but the virus can’t go away in only 2-3 days.
Note that it took ~18 days for China and Italy to reach their peak; ~12 days for S Korea. Those ~18 days are not quite over for USA, Spain, Germany, France, or UK; those ~18 days can be expected to be over by March 30. Remain tuned for some improvements after March 30. There is always light at the end of the tunnel.
Iran is looking like a basket case. Its neighbor, Pakistan, with a population of 200 million, also has an exploding problem, where the government simply doesn’t have the wherewithal to support its citizens, unless its rich benefactors from the Middle East help out in sympathy, which doesn’t sound necessarily likely. While the virus can spread between the Pakistan-Iran borders, India has totally sealed its border with Pakistan with redoubled effort. So, India appears safe. If the virus can sneak into India in a big way, hell can break lose in that country. But, Prime Minister Modi of India has vowed to defeat the virus in 21 days!
Keep praying! Let’s see what tomorrow brings; each day is a new day!
What to do?
- Wipe down every item you bring into the house from outside – such as packets and packages.
- Throw out all empty bags and boxes you bring in! But, we know that the virus can survive on cardboard only for an hour.
- Wash all fruits. Wash apples and oranges in soapy water!
- Use this time to de-clutter your house, and minimize the number of surfaces the virus can reside on. Wear gloves while doing so, and wash your hands after the effort.
- The virus does not stick well to food. So, if you buy hamburgers, turn the box upside down on a plate, and then throw the box away as if it was a virus!
- Think positively, but don’t become macho in your thinking. This virus can catch anyone, even Prince Charles! God really save the queen!
PowerPoint |
3/24/2020 |
The Good News
- South Korea is a model nation that has been able to curtail the growth of the virus. By their aggressive testing, early detection, isolation, and “contact tracing,” they have been very successful. S Korea has not resorted to the type of lockdown that all countries appear to be using.
- China’s daily case numbers are massively below the peak → at 0.4% of the peak value.
- France was the only major country to see a growth decline today.
- Uncle Trump thinks hopes to get Americans back to work by Easter, April 12; but Dr. Anthony Faucci clarified that the Easter date is “flexible.”
- As a result of this social distancing, it is likely that we will beat many hundreds of strains of other common cold and flu viruses, as well.
- The virus is not a threat to the existence of the human race (But, good practice for the next deadlier virus). After all, S Korea is where it is today because it really learned from the SARS epidemic of 2003.
The Bad News
- Just when we thought Italy was rebounding for the better, Italy’s growth was 9.6%.
- So today, Italy, USA, and Spain had close to 9% growth each. Not good!
- China seems to be entering a second wave of virus cases, but at immensely subdued numbers.
- Iran is not showing any promise of controlling the virus. Indeed, the handling of the crisis in Iran has come under severe attack.
- The UK was very explosive today (Growth = 14.76%).
- The average of the recent three days to max peak increased today for all major countries, except Italy. We like to see this ratio going to 0.7, 0.6, 0.5 …. and down to where South Korea is (0.09) … and lower.
- The world had its maximum cases today, i.e., its peak was today! The World’s corresponding Table 2 ratio is very high (0.896), approaching 1.0.
- The world’s profile of new cases is growing steadily at a growth of 11.54% (very high)
- Table 3 represents a more steady moving growth perspective, but across the board it shows a worsening trend for the major countries.
- So far, Italy’s death rate is the highest, at about 10%
- Comparing to our baseline date of March 19, the three day average, Table 4, is looking worse for all major countries, except Italy. So, we hope that the worst-affected country (in terms of death rate) comes to grips with the virus.
- Cyprus and Hawaii had a decline in growth, but community spread has probably started.
- The Olympics have been postponed.
- A fear of terrorists attacking hospitals has been raised!
- Overall comment: the overall situation is looking worse today compared to yesterday.
What to do?
Don’t touch people with even a barge pole! Keep your distance! Humans are the
greatest danger to humans today.
Remain on guard.
Pray that things get better!
PowerPoint |
3/23/2020 |
The Good News
- China’s daily case numbers are massively below the peak → at 0.4% of the peak value.
- Italy’s daily cases have declined two days in a row.
- Hence, the two worst-hit countries above are doing better.
- USA is statistically steady compared to yesterday.
- South Korea is coming to grips with the virus, as daily cases reach the low end of the taper.
- The recent two-day moving data is greatly improved for Italy, S Korea, and UK.
- Uncle Trump thinks that the COVID crisis will be over in weeks, not in months.
The Bad News
- Iran had its maximum daily cases yesterday, surpassing the previous peak of March 14.
- Spain, Germany, and France rebounded with terrible vengeance yesterday, increasing growth at a slope of 1.94:1, 1.67:1, and 2.5:1, in that order.
- Cyprus and Hawaii also had a horrible day, with the daily cases increasing by 1.9 and 2.6, respectively.
- USA continued to increase its cases, albeit at a much slower rate of increase.
- The recent two-day moving data worsened substantially for Iran, Spain, Germany, USA, France, Cyprus, and Hawaii.
- The average of the last three days is worse than for March 19 (when we started the study).
- The Olympics “may” be postponed; the final decision is not out. Not sure if the media information is a dirty, inaccurate leak, or an effort by powerful lobbies to postpone the Olympics when Japan does not want to postpone them.
What to do?
Clean every part of your car that you touch with Clorox wipes: the indicator lever; the wipers’ lever, the lights’
switch, the radio tuner and volume buttons; the a/c knobs and dials; the hand brake, the trunk lever button; the gas
tank lever button; your mirror adjustment knobs; your window handles/buttons; your door handles inside and outside.
Wipe down your microwave buttons; your washer and dryer dials; your dishwasher and stove dials and knobs.
Staying home is best, but if you are going out, keep minimum distance of 10 ft between people (> 6 ft.); avoid elevators whenever possible.
Wipe down all the door handles and entry buttons in your whole office area – including the doors of others, as well.
Meditate!
PowerPoint |
3/22/2020 |
Here is our update today for the growth/decline of COVID-19 in the most affected countries and Cyprus and Hawaii.
All countries, except USA, are on a decline from their former peaks. USA growth from the day before increased by a ratio of 1.9 relative to yesterday! This is very high! But note that USA is also about one week to ten days behind Europe in COVID cases. However, in the overall estimate, the most afflicted countries exhibit a downward trend from their peaks.
China’s cases are a mere 0.3% of their peak, while S Korea is at13% to their peak. In the meantime, Singapore and Taiwan have beaten the virus altogether.
The growth in Italy and Spain declined yesterday, while Germany has declined from its peak and held steady today for two days in a row. Angela Merkel took a COVID-19 vaccine, so she probably increased her chances of catching the virus, but we hope that she instead develops quick immunity to the virus.
Iran has been on a steady 40 degree decline from its peak on March 14. France has also shown a general downward trend since four days. UK, which had a high growth yesterday, is down today by 35.7%, a significant drop. While one day’s decline means little, it is always a welcome sign.
The moving averages of two and three days show a different analysis. The two day analysis gives a more reliable, steady long-term trend than a day-to-day analysis. Excluding China and South Korea, for whom we have little concern remaining, only Iran and Germany showed a steady decline. All other countries registered a growth rate higher than 1.0 of their recent two day average compared to the third day before.
The average of the recent three days to the number of cases on March 19 (the day we started our reports), revealed that only France and South Korea were doing better in recent days. All other countries registered an increase in the average growth. Inasmuch as we are looking for a reduced growth from March 19, this is yet to exhibit itself across the board.
Hawaii (1.4 million people) and Cyprus (1.1 million people) are relatively small populations. They have both held steady at 8-11 cases daily for the past four, and five days, respectively. Even as of today, there is no evidence in Hawaii of widespread community spread. Hawaii started a total lockdown as of 4:30 pm today HST.
In the meantime, India, home to 1.3 billion people – no small joke – had a day curfew the entire Sunday throughout the whole country.
In general, an overall growth of 1.0 means that the growth is holding steady; a growth less than 1.0 means that the virus is being beaten; a growth of more than 1.0 is always cause for alarm.
Today’s statistical analysis yields a mixed bag of results. But, everyday is a new day. We'll see what tomorrow brings!
“Clean clothes” don’t only mean wearing clean clothes, but putting your worn clothes into the washer at the end of the day. And “clean skin” means having your daily bath, at the very least, and bathing twice a day if you contacted outsiders that day. That is, if you wish to not take risks.
The US Surgeon General, even back in 1918, asked people to avoid crowds, and cover your mouth when you sneeze. He ended with an admonition: “Your fate is in your hands: wash your hands.”
These precautions will not necessarily save you from catching the virus, but it sure is helluva lot better to take these precautions than not.
Best wishes – and take care.
God bless.
PowerPoint |
3/21/2020 |
Here is our update today for the growth/decline of COVID-19 in the most
affected countries and Cyprus and Hawaii.
After new cases going to zero in China between March 08 and March 18, China saw a mild resurgence by registering 41 and 39 cases today and yesterday, respectively. South Korea is in a somewhat similar boat as China, in that the number of daily cases are down to a fraction of their respective peaks. Both China and South Korea are seeing a flattening of active cases.
Iran's new cases are on a steady, overall decline since March 14.
Germany and USA, which were both on a perfect exponential curve, saw their growth decline from yesterday by 54.4% and 13.8%, respectively. These are positive indicators.
Italy's growth is declining on a daily basis since 3/19. This means that Italy should be steadily approaching the inflection point, God willing.
Spain and France are still volatile in their outlook. But, UK was positively explosive yesterday. God save the Queen!
Hawaii (1.4 million people) and Cyprus (1.1 million people) are relatively small populations. Cyprus still has volatility. Hawaii's growth exploded on 3/19 from 3 cases to 10, but have been steady since then at 10-11 cases daily.
Everyday is a new day. We'll see what tomorrow brings!
Our charts will be expanded in the next report to show additional statistical measures.
Best wishes -- take care -- wash your hands -- and wipe down all your door knobs and cabinet knobs. Using clorox or wet wipes, wipe down your phones, TV remote, keyboard, mouse, car steering and car gear drive. Wear gloves if you use the elevator or go out; wash your hands, anyway, after you return. Drink an extra glass of water morning and evening. Please ignore this lecture if you already know these, but don't ignore the actions recommended.
God bless.